Unveiling the Mysteries Above: Exploring UFO Sightings in the United States
STA/ISS 313 - Project 1
Abstract
The fascination with unidentified flying objects (UFOs) has captivated minds for decades. For our project, we have delved into a vast dataset of UFO sightings courtesy of the National UFO Reporting Center. Our project aims to shed light on the frequency, distribution, and potential correlations that are associated with UFO sightings in America. Our analysis spans geographical regions, astronomical conditions, and potential influences such as population density and light conditions. Through innovative visualization techniques, we aim to unravel the secrets of UFO sightings, bringing us one step closer to understanding the unexplained phenomena that linger in our skies. Join us as we embark on a quest to unveil the mysteries above.
Introduction
The main dataset under scrutiny in our project is sourced from the National UFO Reporting Center, and offers a compelling glimpse into the world of unidentified flying objects (UFOs). Comprising three key tables ufo_sightings, places, and day_parts_map, this dataset is likely the most comprehensive record available on reported UFO sightings across the United States. With its comprehensive nature does come a drawback as there is no metric for determining the veracity of a sighting.
With a focus on understanding the frequency, distribution, and potential influences of these sightings, our exploration takes us deep into the heart of the dataset. This dataset’s richness lies not only in its sheer volume of observations but also in its diverse array of data types, including geographical coordinates and temporal information, which, when joined with other available data allows us to understand contextual factors such as elevation and population density. This presents an opportunity for multifaceted analysis using data visualization, empowering us to explore the mystery of UFO sightings and offer new insights into this phenomenon.
To supplement our analysis, we have leveraged several external data sources including US census data and data from the International Meteor Organization. From our census data, we were able to construct population density metrics at the city level and compare them with the frequency of sightings in an area. The IMO data offered the most comprehensive list of visible meteor showers available which we used to compare how sighting frequency coincided with the occurrence of visible meteor showers. By leveraging data visualization methods on this dataset and its counterparts, our project aims to shed light on distributions of UFO sightings in the United States and identify potential contributing factors. Understanding why certain regions report a higher prevalence of UFO sightings could offer valuable insights into the underlying dynamics of these phenomena and contribute to a deeper understanding of the broader UFO phenomenon. Ultimately, our quest to unravel the geographical mysteries of UFO sightings is driven by curiosity in the realm of unexplained aerial phenomena.
Question 1: Where are the UFOs?
Introduction
Our first question is an examination of if there is a specific geographical region of the United States that reports a particularly high number of UFO sightings, and what factors might contribute to the frequency of these sightings in a particular region. Our initial hypothesis is that places with less tree coverage, such as the southwest region of the US, will have more reported sightings, as there is much greater sky visibility. To answer this question, we conducted spatial and temporal analysis utilizing ufo_sightings and places, visualizing the density of sightings by location to explore the relationships between number of sightings and the characteristics of the different regions of the United States. Together, the two datasets provide us with latitude and longitude data, city, state, elevation, and population data. We joined these data with census data on population density and US shapefiles using the tidycensus and tigris packages.
Approach
For our analysis, we created two distinct types of plots that provide insights into the distribution of UFO sightings in the United States.
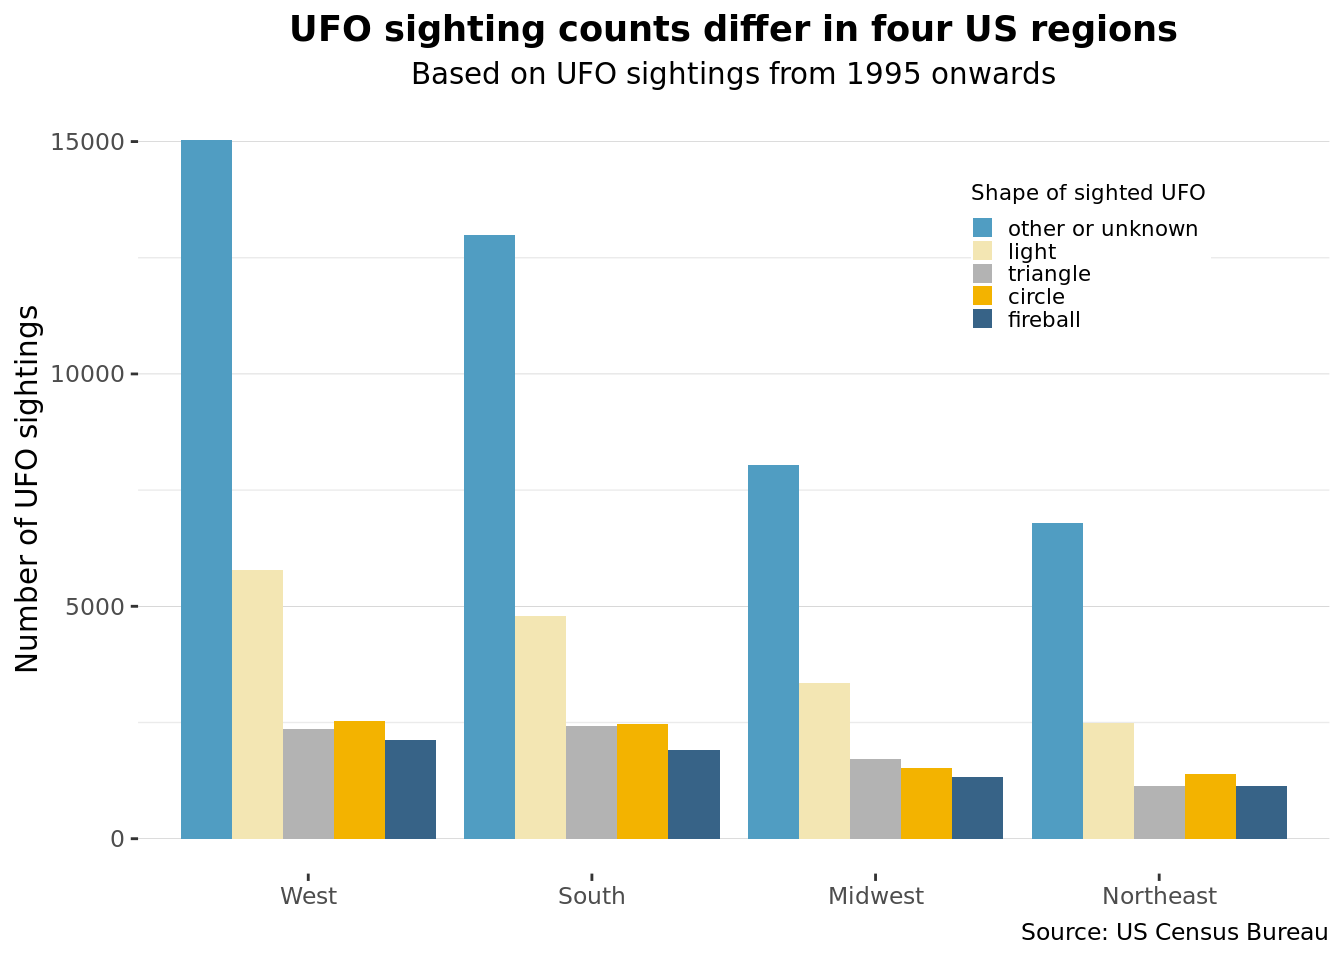
Our first plot is a faceted bar chart showcasing UFO sighting counts by US region. The bars are color-mapped by the shape of the sighted UFOs. This plot allows us to compare sighting counts across different regions and observe if there are variations based on the shape of the reported UFOs. The use of facets provides a clear breakdown, making it easier to interpret the data. We chose a bar chart as they are suitable for displaying categorical data, and faceting will enhance the granularity of our analysis by separating the data based on the observed shapes of UFOs.
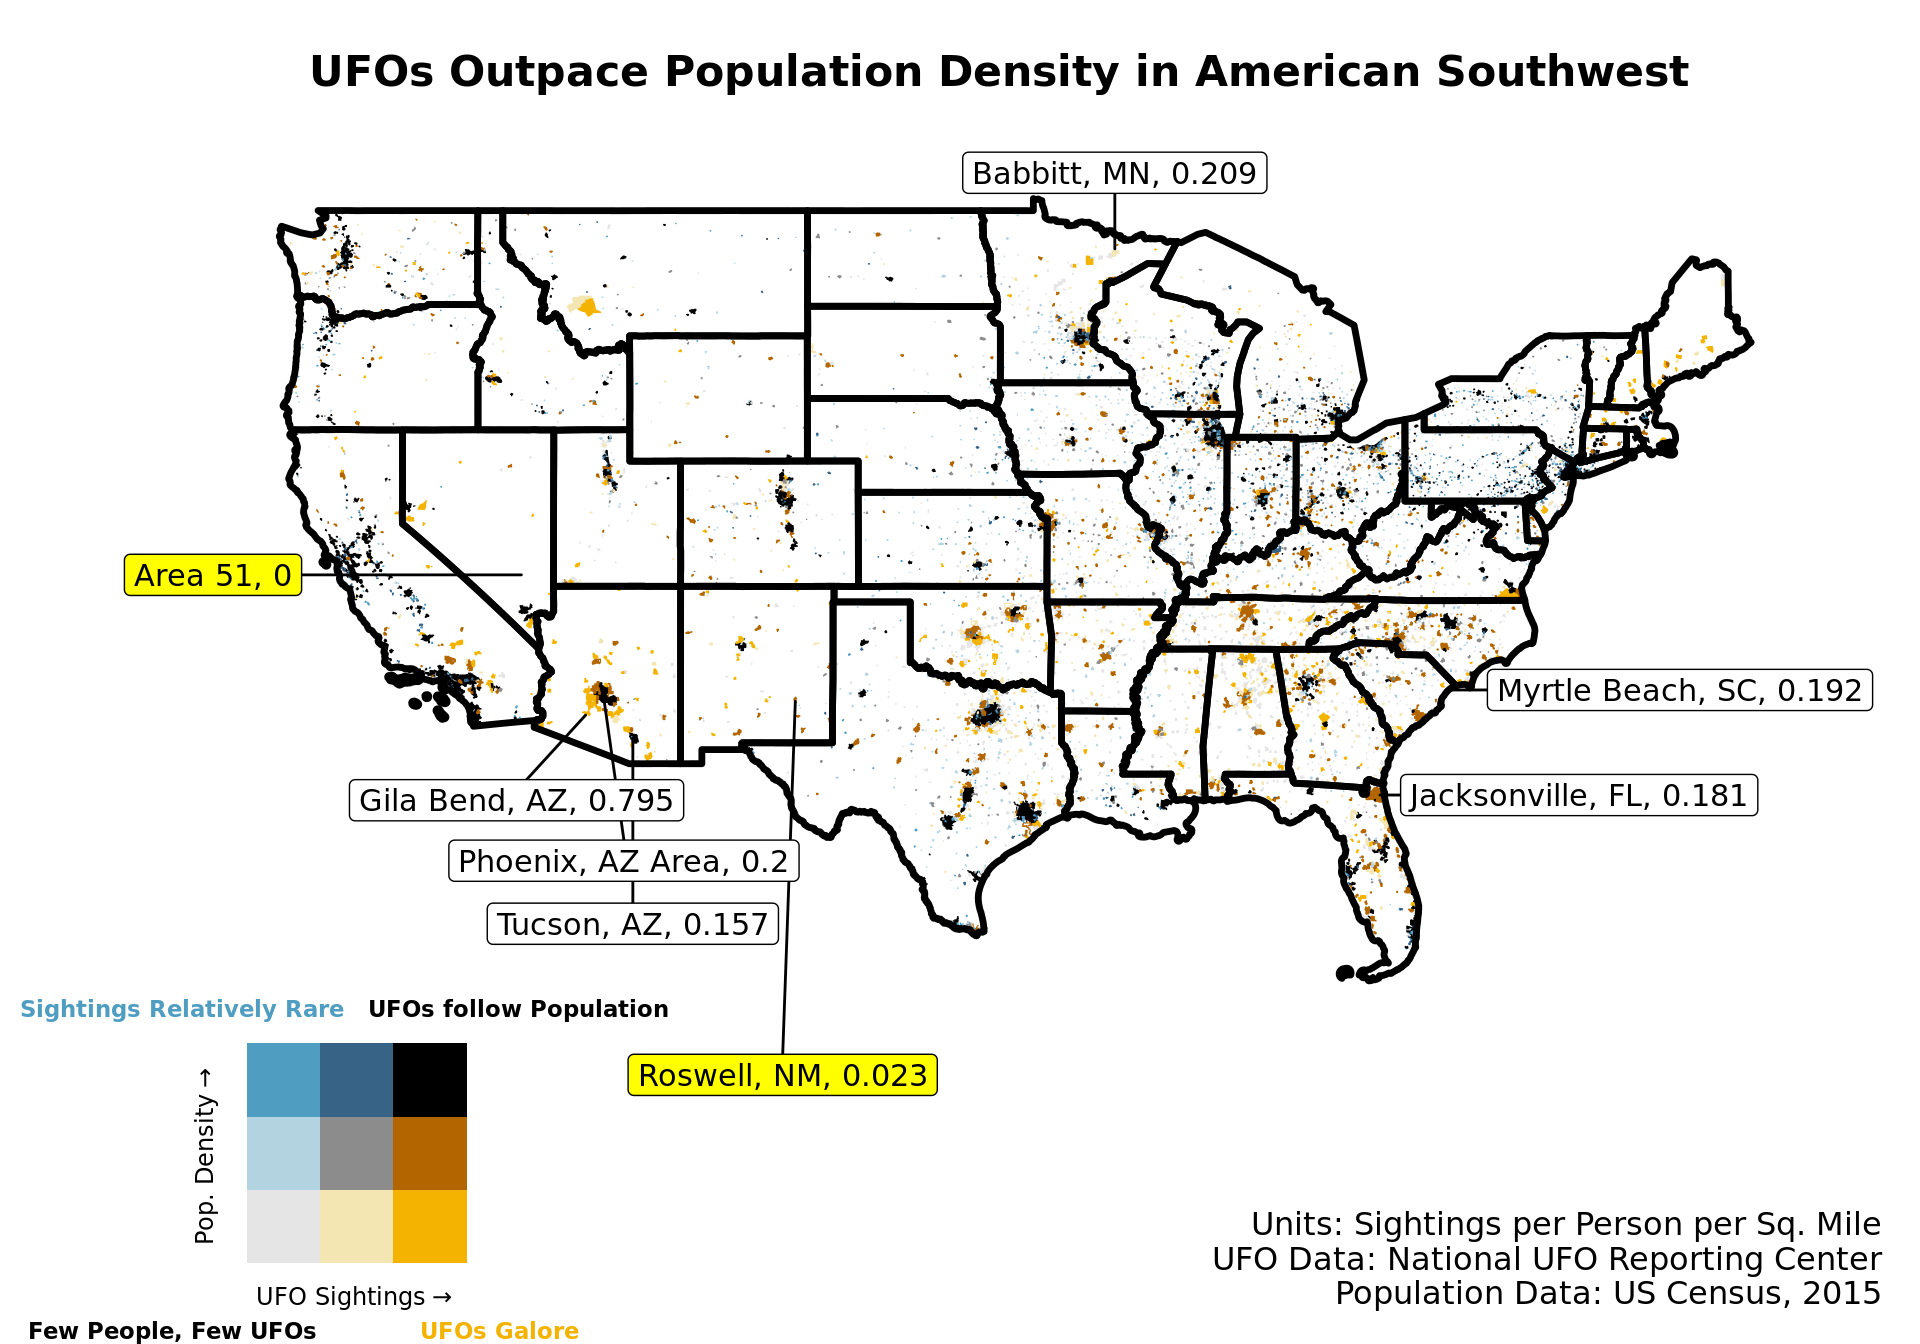
Our second plot is a map of the United States with colors representing the number of UFO sightings in each region. This map is overlaid with information on population density, using different shades to illustrate regions with higher or lower population density as well as a higher or lower number of sightings. This plot helps us visually identify if there are specific regions with a high concentration of sightings and whether population density plays a role in the frequency of reported UFO sightings. We chose to create a map as it is effective in visualizing spatial distributions and relationships. One potential drawback is that our map has very granular data, which while enhancing geographical accuracy, also introduces challenges in interpretability.
Analysis
Discussion
Our bar chart shows that the UFO sightings in the US since 1995 indeed differ by geographical region, with the West having the highest number of sightings. However, the breakdown of the sightings by UFO shapes does not seem to differ by region. The vast majority of sightings are of an unknown shape, and following that is just visible light, which inspires our later examination of celestial conditions. This plot serves primarily to tentatively confirm that there is variation among regions with regard to sighting totals. There is also a question of whether the effects of greater sky visibility and population confound our results. Here is where our second visualization, the map, comes into play.
Our map highlights several particular areas of interest. The first is Roswell, New Mexico, which exhibits a comparatively low sighting rate of 0.023 sightings per person per square mile. Roswell was the site of an alleged UFO crash in 1947. The widely covered event was alleged to be an Army Air Forces balloon crash, but there has been a widespread dispute about whether this was a cover-up. As a result, Roswell is highly associated with UFOs and home to a UFO museum, but experiences relatively few sightings given its population density. On the other side is Gila Bend, Arizona which shows an elevated rate of 0.795 sightings per person per square mile. One limitation that arises here is we have no way of discerning whether areas have some serial UFO reporters. Gila Bend, with its population of just under 2,000 could have a small, yet very active UFO reporting community that skews our results. On the large, sighting frequency does appear to follow population density, as is evidenced by the darker patterns surrounding areas like Los Angeles, Chicago, and Dallas. However, in many regions of the Northeast (which are highly covered in trees), population density tends to run ahead of UFO sightings, while in much of the Southwest (which is not), UFO sightings often run ahead of population density.
Question 2: When do people see UFOs?
Introduction
Moving away from spatial analysis, our second question aims to highlight what atmospheric conditions can be associated with UFO sighting frequency. Specifically, we look at how meteor shower incidence coincides with the number of sightings as well as light conditions and seasons, as a proxy for both daylight hours and time humans are outside, correlate with sighting frequency. We selected these measures because visible meteor shower events have been known to be mistaken for UFO sightings due to their appearance in the sky. Meteors can produce bright streaks of light as they burn up upon entering the Earth’s atmosphere. This can lead observers to interpret them as unidentified flying objects, especially if they are not familiar with celestial phenomena or if the meteor appears particularly bright or unusual. For our examination of daylight effects, we hypothesized that there would be more sightings during traditionally warmer months, as that saw greater numbers of people outside for extended periods of time. However, we did wonder whether that could be counteracted by the way well-lit phenomena would stand out in the extended darkness of fall and winter.
Approach
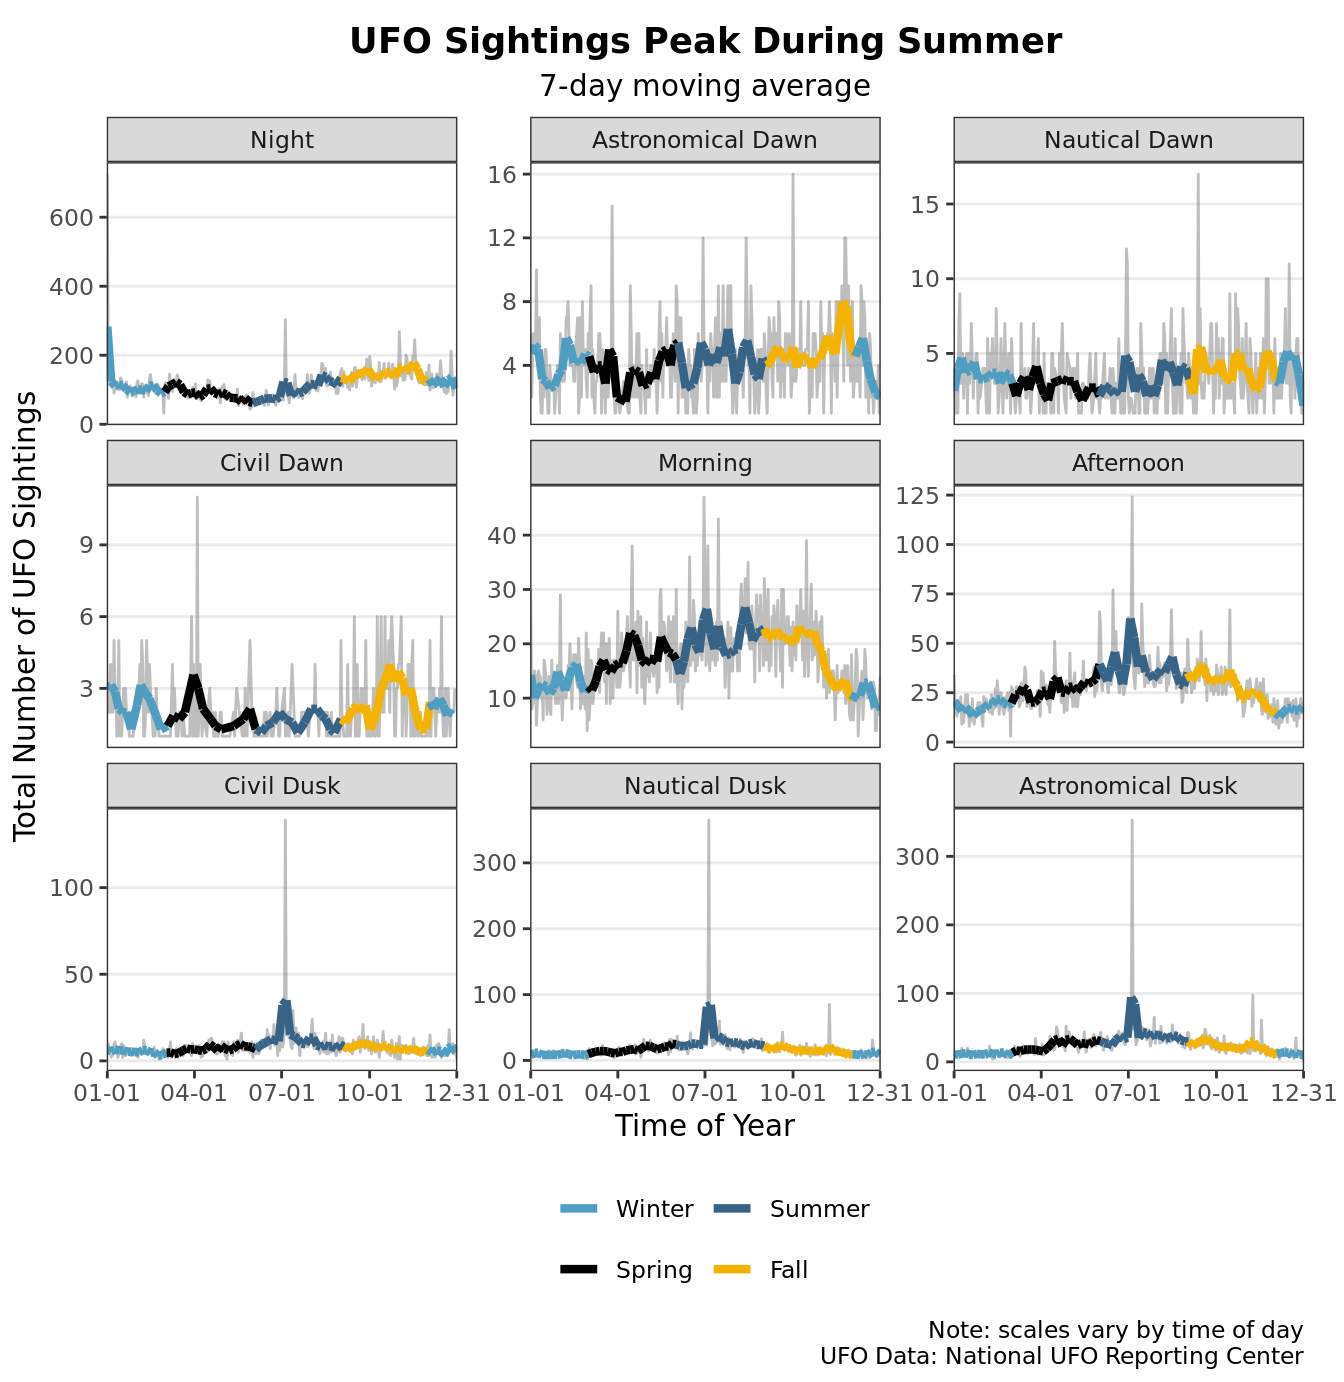
Our first plot is a time series plot that illustrates the aggregate total of UFO sightings utilizing a line graph with smoothed lines faceted by time of day. Because of this plot’s ability to elucidate temporal patterns and seasonal fluctuations in UFO sightings, we believe it to be a highly effective tool for comparison between different parts of the day and revealing trends over time. Further, color mapping based on seasons enhances insights into seasonal variations. Looking at those patterns and fluctuation depicted in the plot, insights into the relationship between light conditions and UFO sightings can be better understood. The approach of summing sightings on each day offers a broad overview of temporal trends but may lack precision compared to using measures like mean or median. While summing sightings simplifies the visualization process and still highlights overall trends, subtler variations within the data could have been lost.
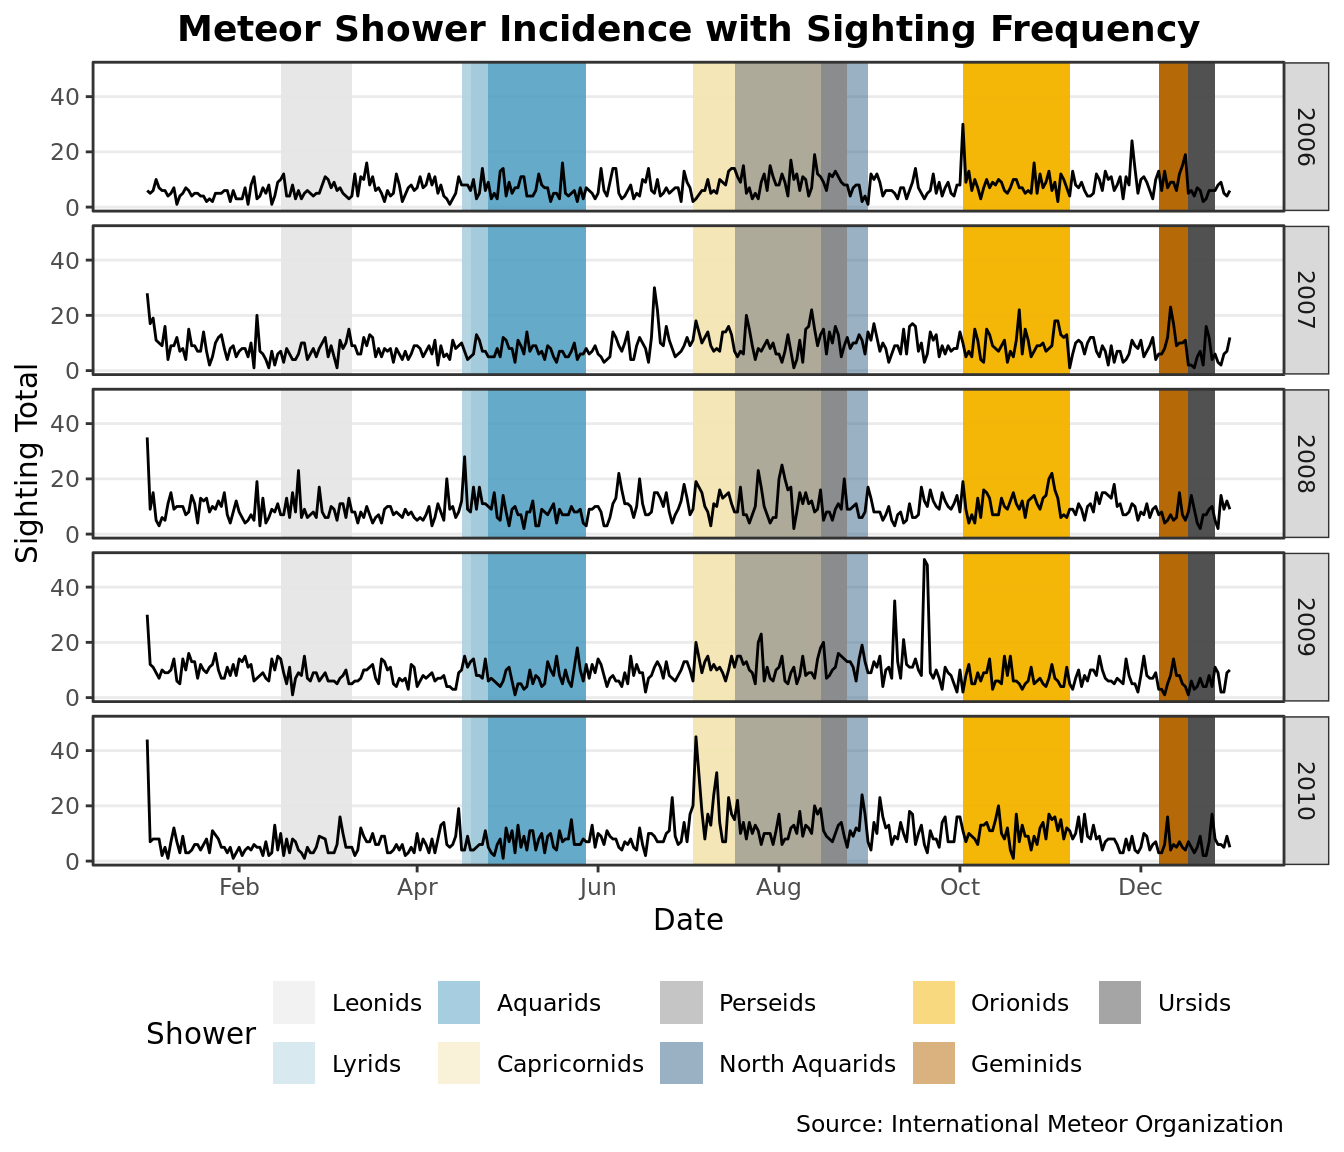
We follow this with another plot that juxtaposes the incidence of meteor showers with the frequency of UFO sightings over time. The plot utilizes geom_rect to represent the duration of meteor showers, with different fill colors indicating different shower events. Overlaying this, a line graph illustrates the count of UFO sightings in the United States for the years 2006-2010. These years were selected because they were the years with the most comprehensive data on visible meteor showers. We faceted to organize the data by year, allowing for easier comparison across different years. By using the background rectangles to denote meteor shower periods viewers can quickly discern any potential correlations or patterns between the two phenomena.
Analysis
Discussion
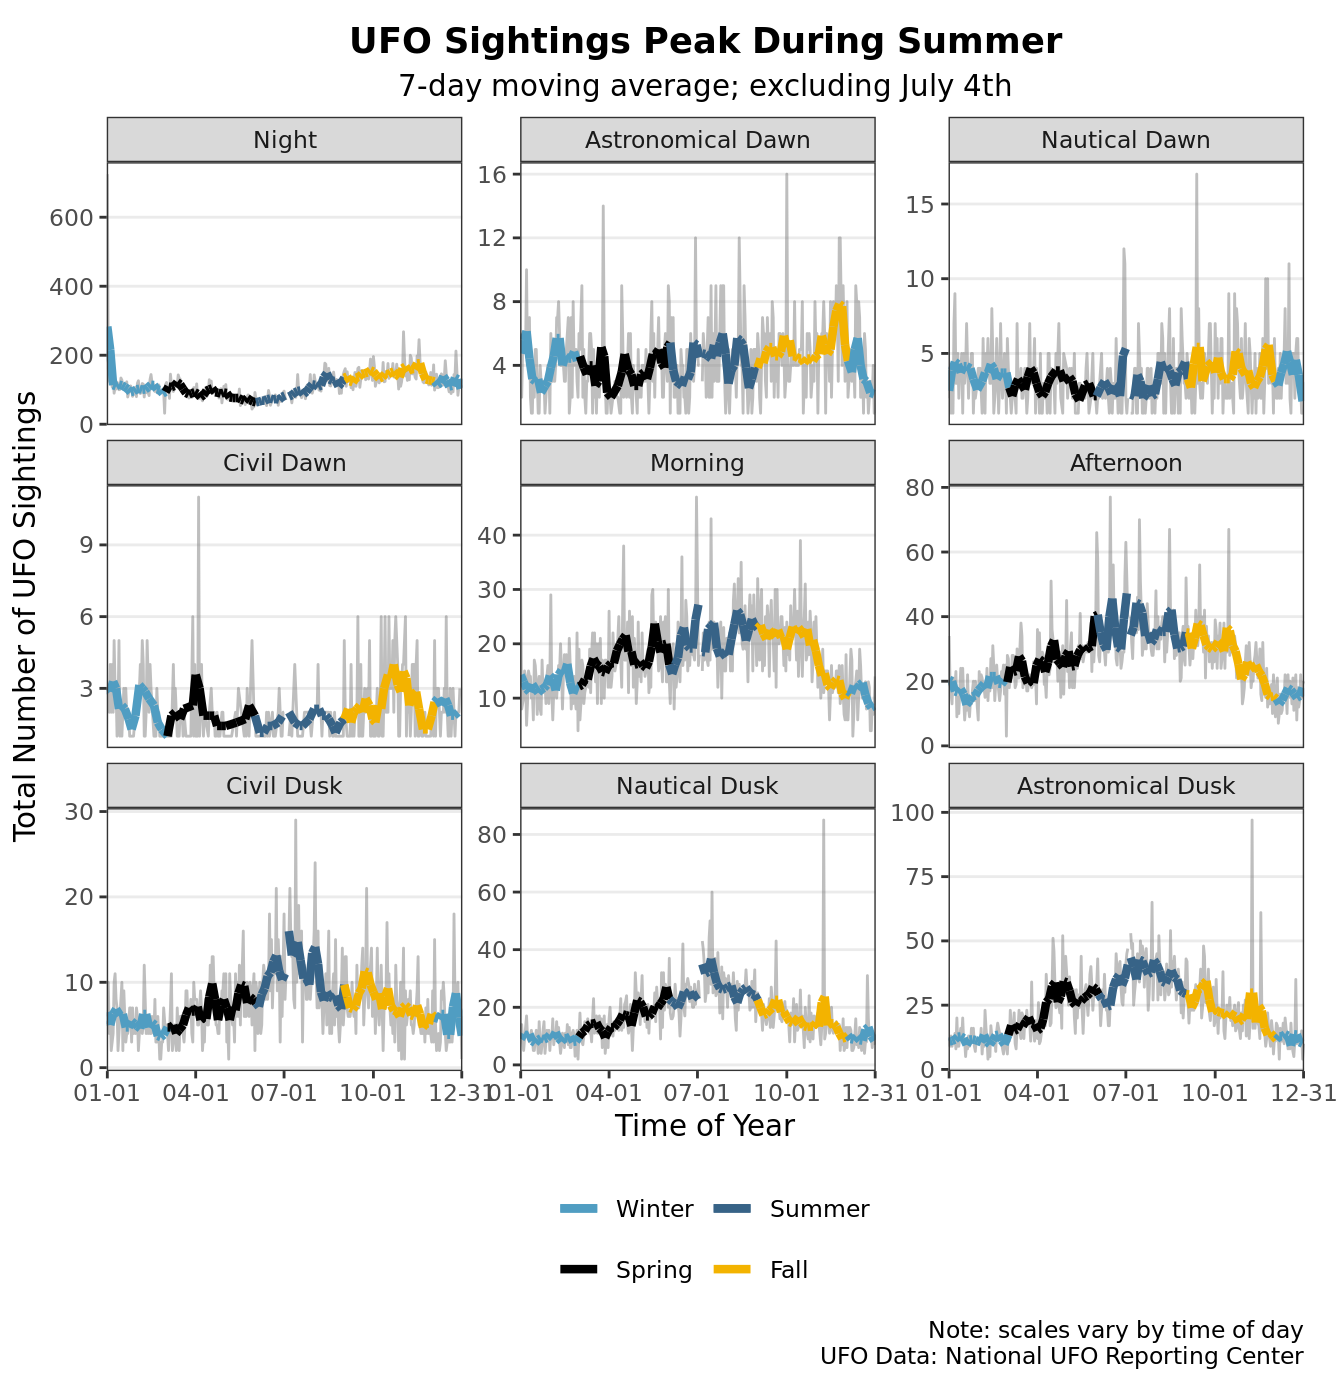
Our plots highlight two main outliers: New Year’s Eve and the Fourth of July. In the United States, the 4th of July is Independence Day and Americans traditionally set off fireworks that light up the night sky. Despite the general understanding of this tradition domestically, we saw in the data that sightings spiked in such a way that could only be understood as people reporting fireworks, which are in fact, identifiable flying objects. For example, in the year 2010, there was a mean sighting rate of 8.23 sightings per day. On July 5th, 2010, however, there were 154 sightings. These outliers are especially salient in the few periods after dark, such as civil, nautical, and astronomical dusks, as well as overnight. This is the reason why we also chose to visualize a variant of the first plot, taking out the dates of July 4th-5th (the midnight that many shoot or watch fireworks). Beyond that, the number of sightings peaks in the summer and is lower in the winter, following times that people are generally outside. Sightings are most prevalent at night and at dusk (people are often awake & better visibility); they are less prevalent during the dawn (people are asleep) and the day (too much natural sunlight).
We speculated that meteor showers — most of which occur in the summer — may play a role in the high prevalence of UFO sightings in the summer. As such, we chose to visualize the relationship between meteor showers and UFO sightings throughout the year, during the years from 2006 to 2010 (the years with some of the highest counts of UFOs). For simplicity’s sake, we only included nine meteor showers, and again removed July 5th. From the plot, we can see that whether or not a meteor shower is present generally does not affect the number of UFO sightings. Together with the first time series plot, and the fact that the most common shape of UFOs reported is “light”, it is most likely the case that human activity is an important factor in UFO sightings. That is, it seems likely for there to be many UFO sightings when people are active outside and see human-made lights, such as fireworks, compared to natural phenomenona such as meteor showers.
References
US Census Bureau data on US regions:
https://www2.census.gov/geo/pdfs/maps-data/maps/reference/us_regdiv.pdf
Creating spatial plots in R tidyvers:
https://vizdata-s24.slack.com/archives/C06H8UZ61HN/p1709103984135549
Remove last word from string in R:
https://vizdata-s24.slack.com/archives/C06H8UZ61HN/p1709103995248439
Using bi-scale colorblind friendly colors in R:
https://vizdata-s24.slack.com/archives/C06H8UZ61HN/p1709104005730889
https://jakubnowosad.com/posts/2020-08-25-cbc-bp2/
https://vizdata-s24.slack.com/archives/C06H8UZ61HN/p1709104015449219
Meteor shower data:
https://vizdata-s24.slack.com/archives/C06H8UZ61HN/p1709148621103049