Squirrelytics: Central Park Squirrels
STA/ISS 313 - Project 1
Abstract
Due to our curiosity about squirrels, our project investigates squirrel location, behavior, and interactions with humans in New York City’s Central Park. Using a Squirrel Census data set from 2018, we use a scatter plot to map where squirrels are located within Central Park, as well as utilize variations of bar charts to further differences in locations of sightings and squirrel behavior. We found that there is no particular pattern of squirrel location within Central Park by age or color, although gray squirrels were most commonly sighted. More squirrels were observed on the ground than above the ground. Additionally, the most commonly-observed squirrel activity was foraging, especially at night, and chasing was the least-commonly observed activity. Finally, squirrels were largely indifferent to humans as they were partaking in each activity type, but they were more likely to run from humans if they were already running or climbing. From these visualizations, we conclude that the behavior and location of squirrels in Central Park is more complex and varied than we initially hypothesized. It is important to note that data was collected for a month during October 2018 and cannot be generalized to all activities and types of squirrels found in Central Park today.
Introduction
The Central Park Squirrel Census data set collected data from an October 2018 census of squirrels in New York City’s Central Park. In the census, volunteers recorded information about squirrel sightings, including the location of the sighting, characteristics of the squirrel, and activities it was engaging in. More information about this Census is listed here. Over the span of one month, volunteers recorded data about 3,023 squirrels. They collected information about 31 variables including longitude and latitude, date of sighting, fur colors, age category, above/below ground location, activities (running, chasing, climbing, etc.), and various interactions between squirrels and humans.
Question 1: Squirrel Locations in Central Park
Introduction
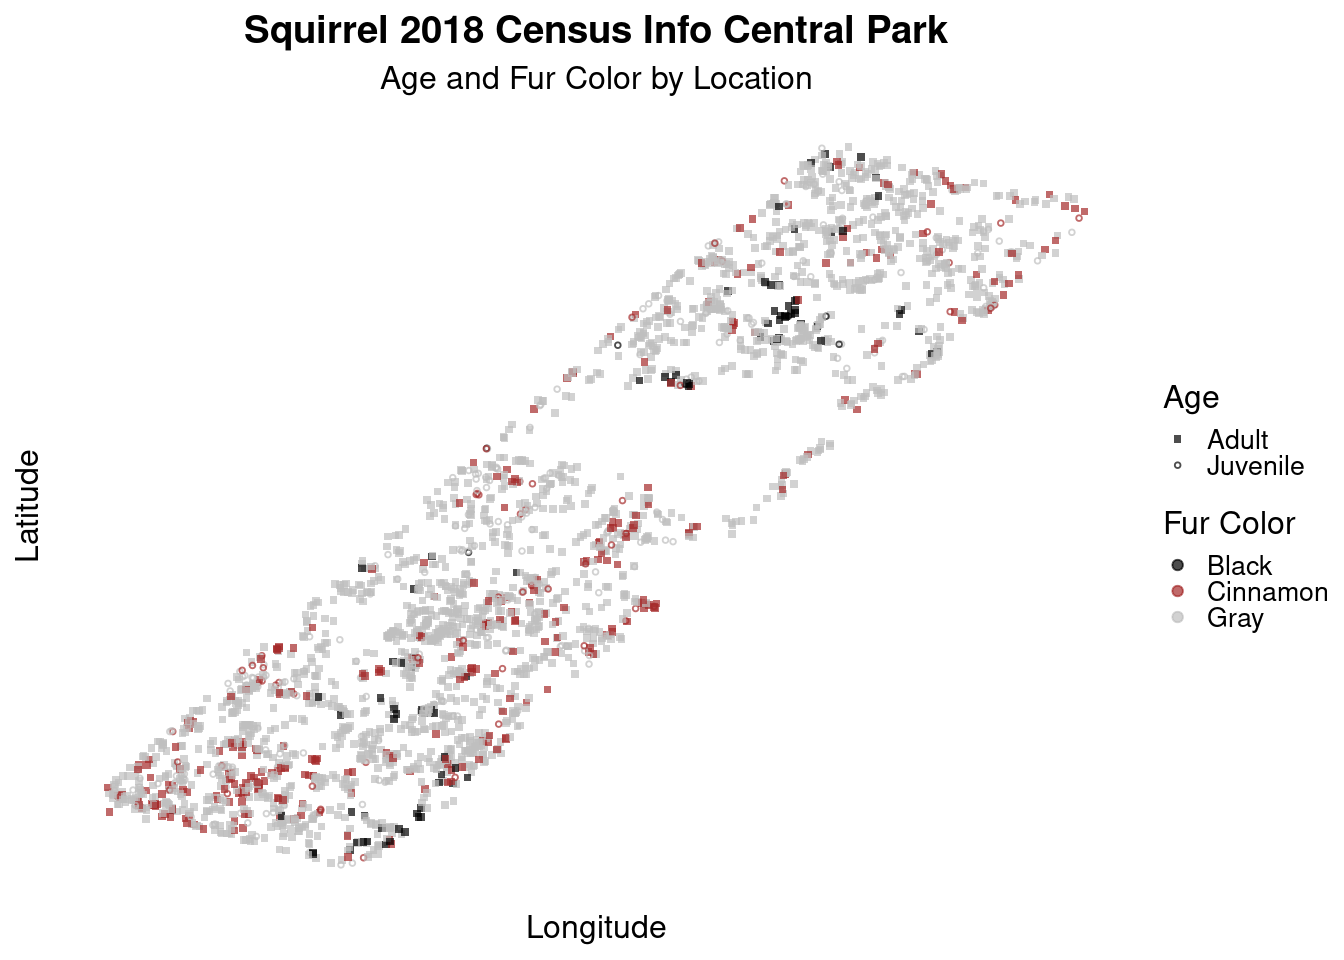
Our first question is: Where do different colors and ages of squirrels reside in Central Park? We plan to use five variables to answer this question: longitude (x), latitude (y), above/on ground (location), age, and primary fur color (primary_fur_color). There were two ages of squirrels observed: adult and juvenile. There were also three fur colors observed: gray, cinnamon, and black.
We are interested to see if there are certain areas within the Park where squirrels congregate, or if they are spread out over the entire park. We are also curious to see if there are differences in where juvenile squirrels spend time. Finally, after doing outside research, we see that there are two main types of squirrels: ground squirrels and tree squirrels. Ground squirrels are mainly gray and brown while tree squirrels are black, orange, red, and brown. We are interested to see if the Central Park data confirms this information and whether or not the squirrels who were recorded above ground are mainly black and cinnamon colors.
Approach
For the first plot, we plan to create a scatter plot in the shape of Central Park to show where different colors and ages of squirrels reside in the Park. We will create this scatter plot by plotting longitude and latitude on the x and y axis, respectively. This scatter plot will then use color and shape mapping to represent the locations of different colors (primary_fur_color) and ages of squirrels. A scatter plot is the best plot to display the locations of squirrels because we have access to the longitude and latitude of the squirrel sighting, so the scatter plot will take the shape of Central Park. Since we have this unique geospatial data, we have a unique opportunity to plot the map. We also have enough observations to form an accurate picture of the Park.
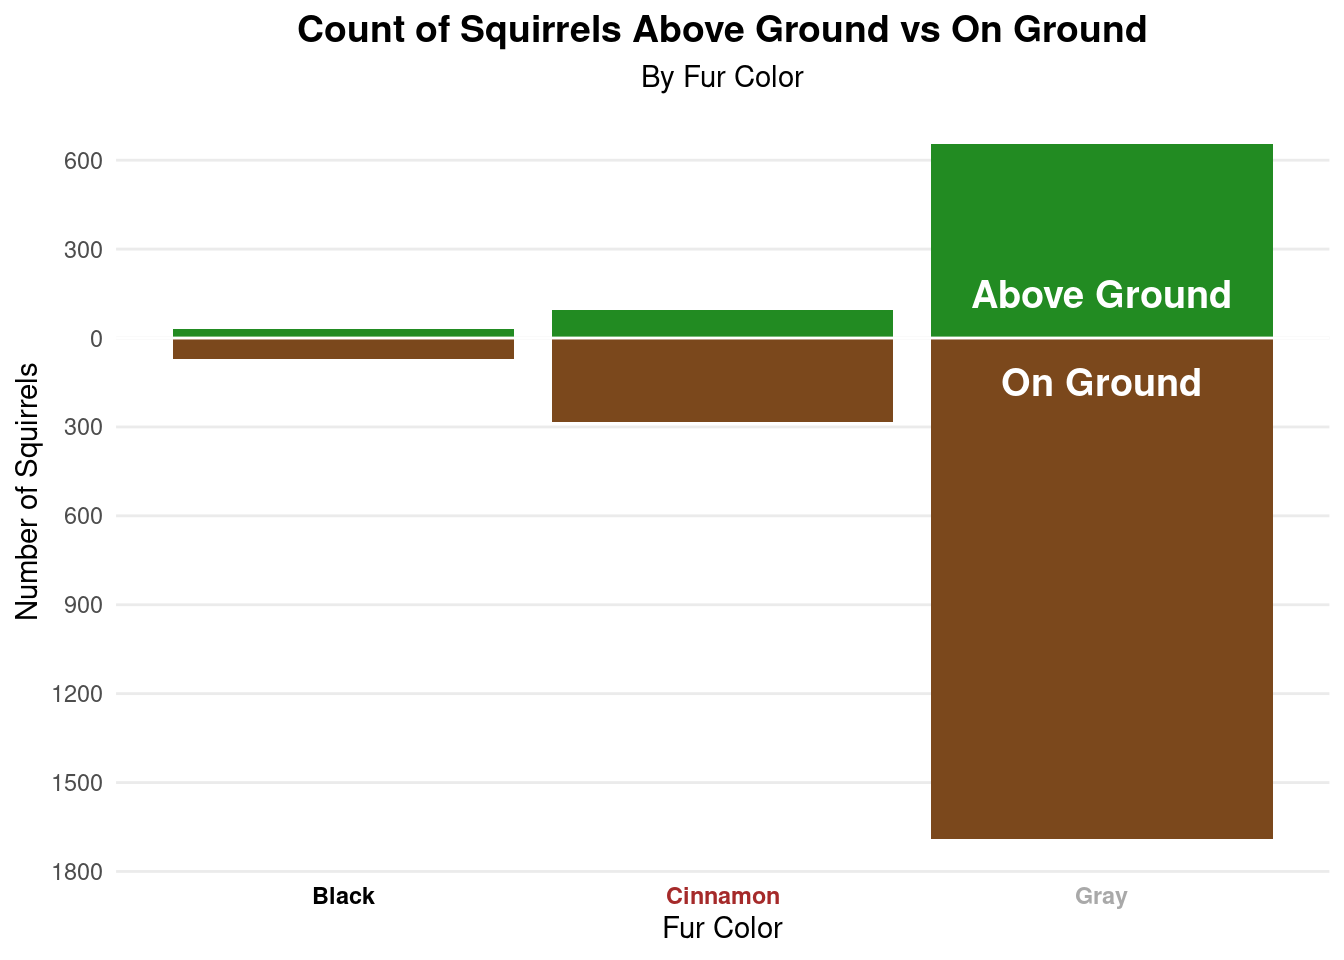
The second visualization will examine whether squirrels were sighted above ground or on the ground plane. We will use a bar chart to count the number of squirrel sightings above ground (in a tree) or on the ground plane by the primary fur color of the squirrel. We want to use a bar chart with count, instead of a filled bar chart with the proportion, to show the number of observations for each location. This will help us determine whether more squirrels were observed above the ground or on the ground plane, or if the observations are similar between both locations. This bar chart will be positioned vertically with bars going up above the x-axis to represent squirrels above the ground (in trees) and bars below the x-axis to represent squirrels on the ground plane. We also will use aesthetic choices including color to represent fur colors and location to make it easier for the reader to distinguish.
Analysis
Discussion
In the first plot, we examine where the observed squirrels are located within Central Park. These squirrels are also distinguished by fur color (gray, cinnamon, and black) and by age (juvenile vs adult) using color and shape mapping. Since we plotted longitude and latitude, the scatter plot takes the shape of Central Park, so we can see an accurate map of the Park including an area without any observations that represents a lake. When examining the observations, it is apparent that there are many more adult squirrels than juvenile squirrels, and the juveniles seem to be evenly dispersed around the Park by color and location with the other squirrels. There do not appear to be any particular nesting or familial places where juvenile squirrels were observed. The cinnamon squirrels are located everywhere, but are especially clumped in the southwestern corner, south of the lake, and the northeastern corner. The black squirrels are the least common color type, but have relative clumps north of the lake and in the southeastern corner. The grey squirrels are the most commonly-observed color of squirrel. There appear to be no clear trends in squirrel locations throughout the Park by either color or age.
In the second plot, we are investigating the number of squirrels that were observed above ground versus on the ground plane by fur color. We can see that more squirrels were observed on the ground than above the ground, regardless of fur color. Possible reasons behind this could be if squirrels primarily reside on the ground to collect acorns and travel around the Park. The main difference between fur colors is the sheer number of gray squirrels versus cinnamon and black colored squirrels, although the relative proportions of above ground versus on ground look similar. This is interesting, as we had previously hypothesized that cinnamon and black squirrels might be more likely to reside above ground if they are tree squirrels.
Question 2: Squirrel Activities and Behaviors
Introduction
Our second question is: How are squirrel activities affected by the time of day or interactions with humans? We plan to use nine variables: time of day (AM vs PM, shift variable), running, chasing, climbing, eating, foraging, approaches, indifferent, and runs from, all of which are categorical.The five squirrel activities recorded are: running, chasing, climbing, eating, and foraging. The three interactions with humans observed are whether the squirrel approached the human, was indifferent toward them, or ran from the human.
We are interested to see how different factors influence the activities of squirrels. We wonder if the time of day correlates with squirrels partaking in specific activities. This could be if squirrels are more active at one time of the day. We hypothesize that squirrels will be more active in the morning, so there would be more observations of activities in the AM. We also figure that the way that individual squirrels interact with humans (runs from, approaches, indifferent) could correlate with them being more likely to partake in specific activities. We hypothesize that squirrels who are more active in the activities they do may be more likely to run from or approach a human, while squirrels who are partaking in inactive activities such as eating may be more indifferent toward humans. We plan to display two visualizations to focus on differences in squirrel activities based on time of day and interactions with humans.
Approach
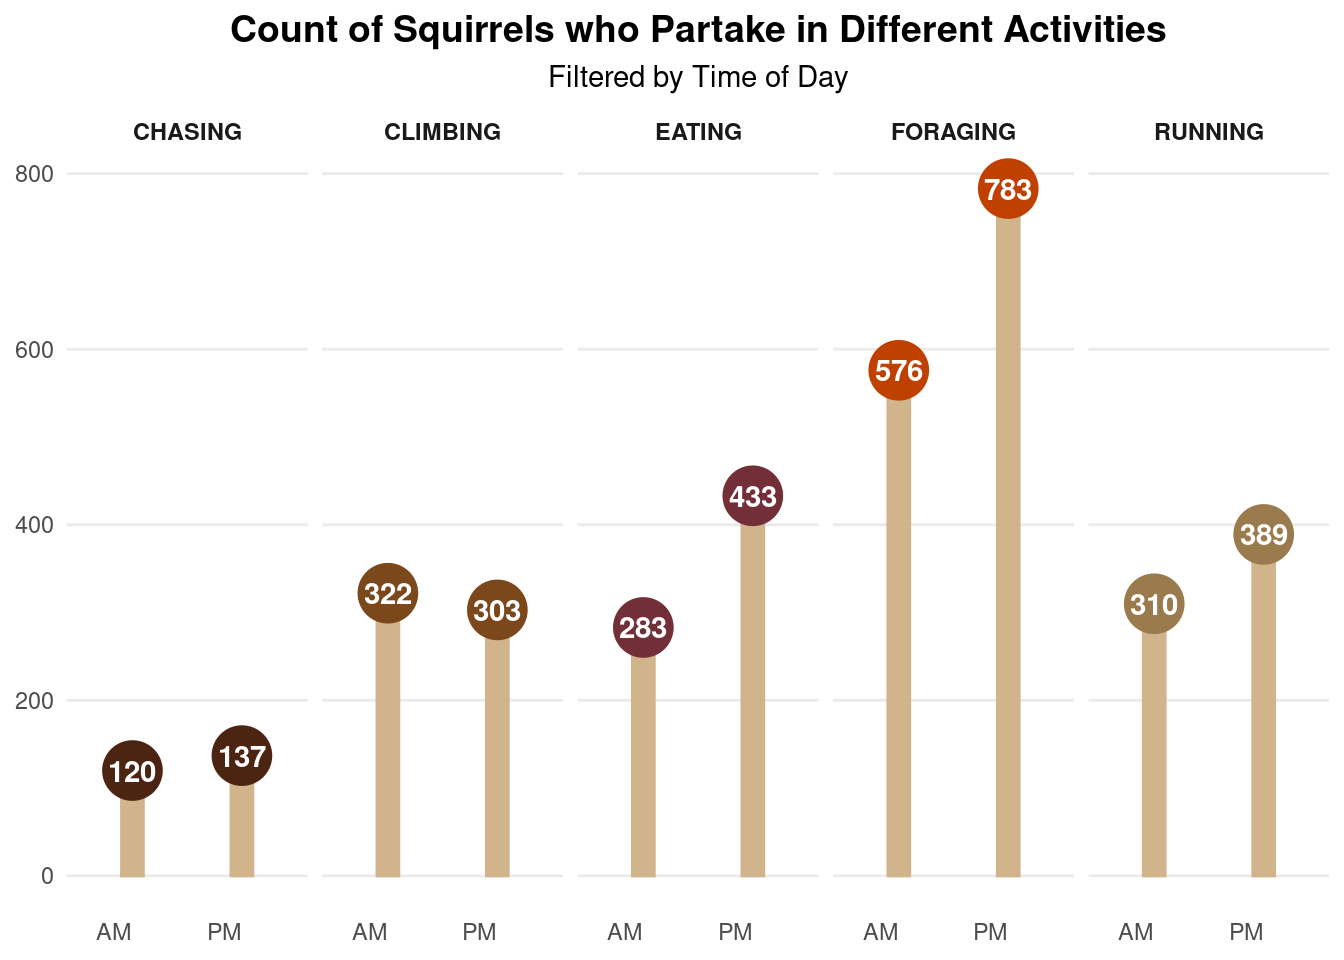
In the first plot, we plan to use a lollipop chart to look at the distribution of the number of squirrels by activity type, and then further divided by the time of day (morning or afternoon). We will make the lollipop chart by combining geom_col() with geom_point(), and will give each point and bar a unique color based on the activity type. We use an earth-toned color theme to represent the nature of the data. In the plot, we will separate the five different activities by faceting. Lastly, we plan to display the count number within the point of the lollipop, allowing viewers to more easily understand the exact differences in observation numbers based on activity type and time of day. We are specifically interested in the number of observations for every activity by time of day, not the proportion. This is also why we used a lollipop chart, so we could represent the data in the same way as a bar chart but also include the number of squirrels (count) in the point.
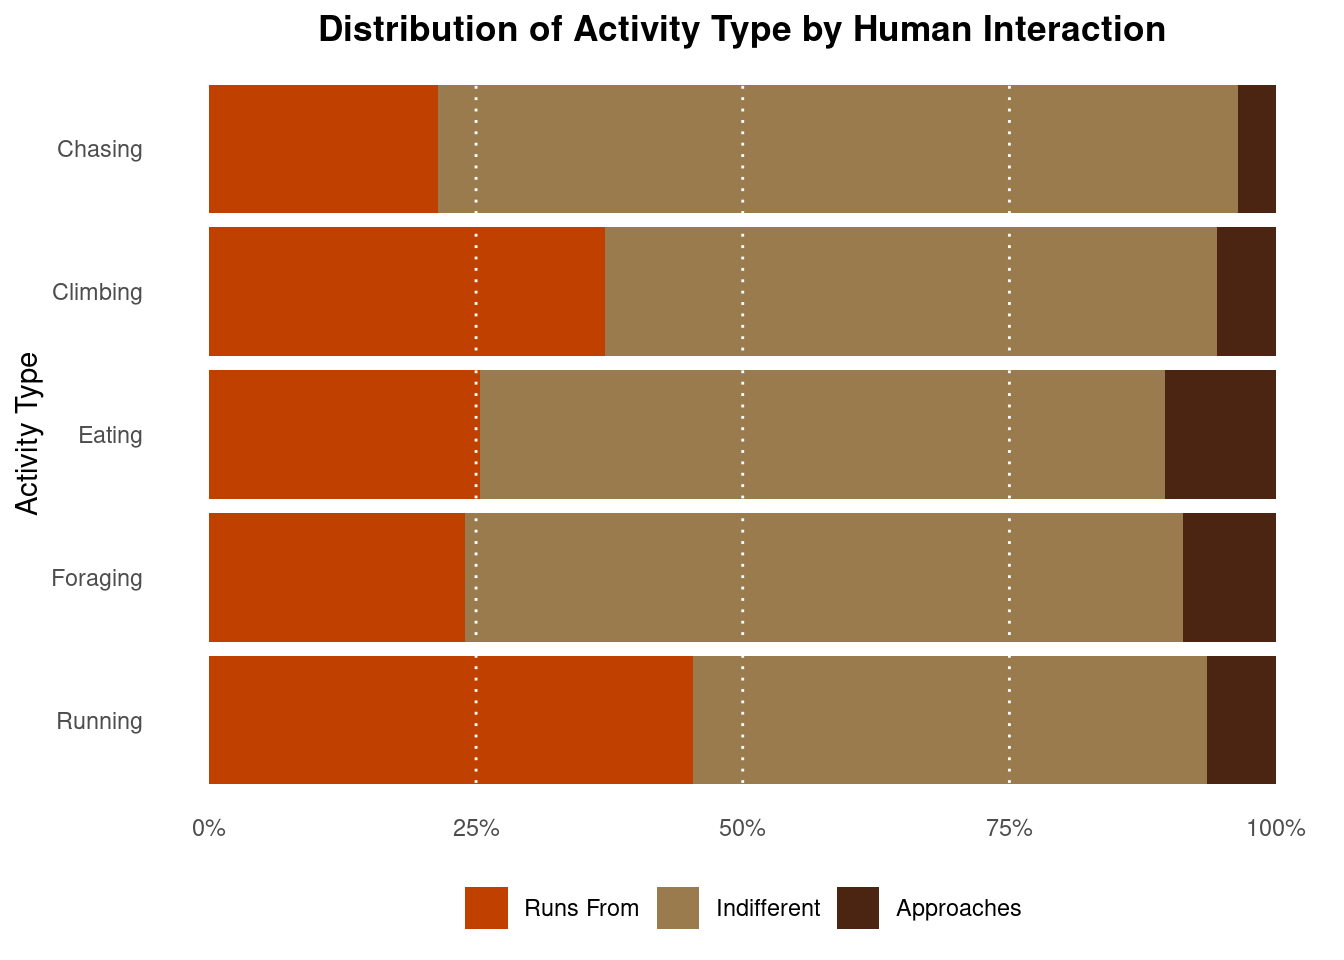
For the second plot we will use a horizontal bar chart to analyze the distribution of human interactions - “Runs From”, “Indifferent”, and “Approaches” - as categorized by the activity type of the squirrel. We will use a filled bar chart to see the relative frequency of each human interaction, and the fill function to give each interaction a unique color that divides up the individual bars by the three human interaction types according to their relative percent. We are interested in comparing the proportions of squirrels engaged in all these activities, so a filled bar chart makes the most sense to visualize this. Lastly, we will scale the x-axis by intervals of 25%, and include dashed lines from these values such that it will create clear frequency marks that allow for the percentages to be more easily distinguishable.
Analysis
Discussion
The first plot examines a count of squirrel activities faceted by time of day. It is apparent that across four of the five activities, there were observations of squirrels participating in the activities in the PM. Of the listed activities, the most squirrels observed were foraging and chasing had the least number of squirrels observations. Approximately 500 more squirrels can be found foraging in either the AM or PM compared with chasing. Additionally, climbing is the only activity where the number of squirrels participating in the activity in the AM outnumbers the PM count. This is interesting, as we had previously hypothesized that there would be more observations of squirrels partaking in all activities in the AM. It is important to note that this plot focuses on raw squirrel activity numbers, not the likelihood that a squirrel is going to partake in an activity. This data tells us the raw count of squirrels found partaking in these activities in the specific 2018 Census. A person may find this useful if they are in Central Park at a certain time of day, as they can know how many squirrels were historically found doing different activities at that general time.
In the second plot, it is apparent that each of the activity types has a different distribution of human interaction behaviors, although there are some overall similar trends. Squirrels that were observed running also were also observed exhibiting “Runs From” humans behavior the most. Squirrels that were observed chasing were also observed exhibiting “Runs From” behavior the least. “Runs From” was also the second most common exhibited trait of the three human interaction behaviors for each of the different activity types. This makes sense based on our experiences with squirrels being shy around humans. Furthermore, “Indifferent” is the largest proportion of each of the bars, showing that no matter the activity type, a majority of the squirrels observed are indifferent to humans most of the time. This is especially true for squirrels that were observed chasing, and the least applicable to squirrels that were running. This has an interesting contrast to the “Runs From” category, which had chasing squirrels as the smallest overall percentage and running squirrels as the highest. This suggests that it is possible that squirrels who are chasing are less likely to be afraid of humans, while squirrels who are running are more likely to be. This notion however is not supported by the “Approaches” category because chasing squirrels have the lowest relative frequency to approach humans, but squirrels who were eating have the highest relative percentage of approaching humans. We hypothesize that squirrels who are eating may want to receive food from humans, so they may be more likely to approach them. The “Approaches” behavior also represented the smallest category of the three different human interaction types for each of the activities.
Our data shows interesting observations about squirrel activities in Central Park in October 2018. Squirrel locations in the Park are varied, even for different fur colors and ages of squirrels. Also, the observed behavior of squirrels is complex and did not match our hypotheses about the time of day when squirrels were more active and how interactions with humans influence squirrel activities. It is important to note that this data was only collected in one month, so these trends are not fully representative of all squirrel behaviors in Central Park during the whole year. The data was only collected during the month of October, so we were not able to compare trends in behaviors and locations between seasons and other parts of the year. It would be interesting to conduct a follow-up census for the span of a year to collect the most representative data to examine monthly and seasonal trends.