A large number of factors play into the performance of athletes in long distance races, such as marathons. Understanding the different variables that play into the outcomes of these races can be beneficial to athletes, coaches, and race organizers. This project utilizes data from the London Marathon, which is sourced from the April 25, 2023 Tidy Tuesday Project. We analyze how run times have varied from 1981-2020 for male and female runners as well as male and female wheelchair races, specifically taking into account temperature. We also analyze how the London Marathon acceptance rate has varied from year to year as well as by decade. Our findings show that run times have either remained the same or decreased over time, with weather having a relatively small effect. Acceptance rate has been below the average for all years except 1981 and from 1988-2008. The highest acceptance rate occurred from 1991-2000 and the lowest from 2011-2020. These results can help races better understand the performance needed to remain competitive and race organizers gain more insight into how acceptance rate has varied over time.
library(tidyverse)
── Attaching core tidyverse packages ──────────────────────── tidyverse 2.0.0 ──
✔ dplyr     1.1.4     ✔ readr     2.1.5
✔ forcats   1.0.0     ✔ stringr   1.5.1
✔ ggplot2   3.5.0     ✔ tibble    3.2.1
✔ lubridate 1.9.3     ✔ tidyr     1.3.1
✔ purrr     1.0.2
── Conflicts ────────────────────────────────────────── tidyverse_conflicts() ──
✖ dplyr::filter() masks stats::filter()
✖ dplyr::lag()    masks stats::lag()
ℹ Use the conflicted package (<http://conflicted.r-lib.org/>) to force all conflicts to become errors
library(ggplot2)library(hms)
Attaching package: 'hms'

The following object is masked from 'package:lubridate':

    hms
library(gridExtra)
Attaching package: 'gridExtra'

The following object is masked from 'package:dplyr':

    combine
Introduction
The data we decided to use for our project comes from Tidy Tuesday’s London Marathon page, which has two datasets. These data comes from Nicola Rennie’s LondonMarathon R package, and contains two datasets: winners.csv and london_marathon.csv. The LondonMarathon Package was scraped from Wikipedia. The winners dataset contains information on the winners of the marathon, the category of race (men, women, wheelchair men, wheelchair women), the winner’s nationality, and the winning time. The london_marathon dataset contains the date of the race, the number of applicants, the number accepted, the number of people who started the race, the number of people who finished, how much was raised for charity, and what the official charity for the race was. The marathon data was scraped from Wikipedia using the rvest package, and then cleaned up using dplyr to make them into working datasets.
Question 1: Performance Across Race Categories vs. Weather
Introduction
The first question we want to answer is how winning performances amongst the four different categories has changed over time and how these performances vary from year to year. Specifically, have these times decreased over time, and are certain types of races more variable on a year to year basis than others? Some of the parts of the datasets that will be necessary to answer the question include the category of race and the winning time, both of which will come from the winners dataset. We will also add temperature data to our london_marathon data frame for each year. These temperature values will be from NOAA historical weather data, representing the temperature of a particular race day at 9 AM.
We want to explore this question because from our prior knowledge we see that technology, as well as training techniques, have improved tremendously over the years, and we want to see the potential effects of these factors on time. Also as a second part to our question, we will be comparing temperature data to winning times, again as we speculate that race temperature could play a role in finishing times. If there is noticeable correlation between temperature and winning times, will this affect all four race categories the same, or some more than others?
Approach
(1-2 paragraphs):
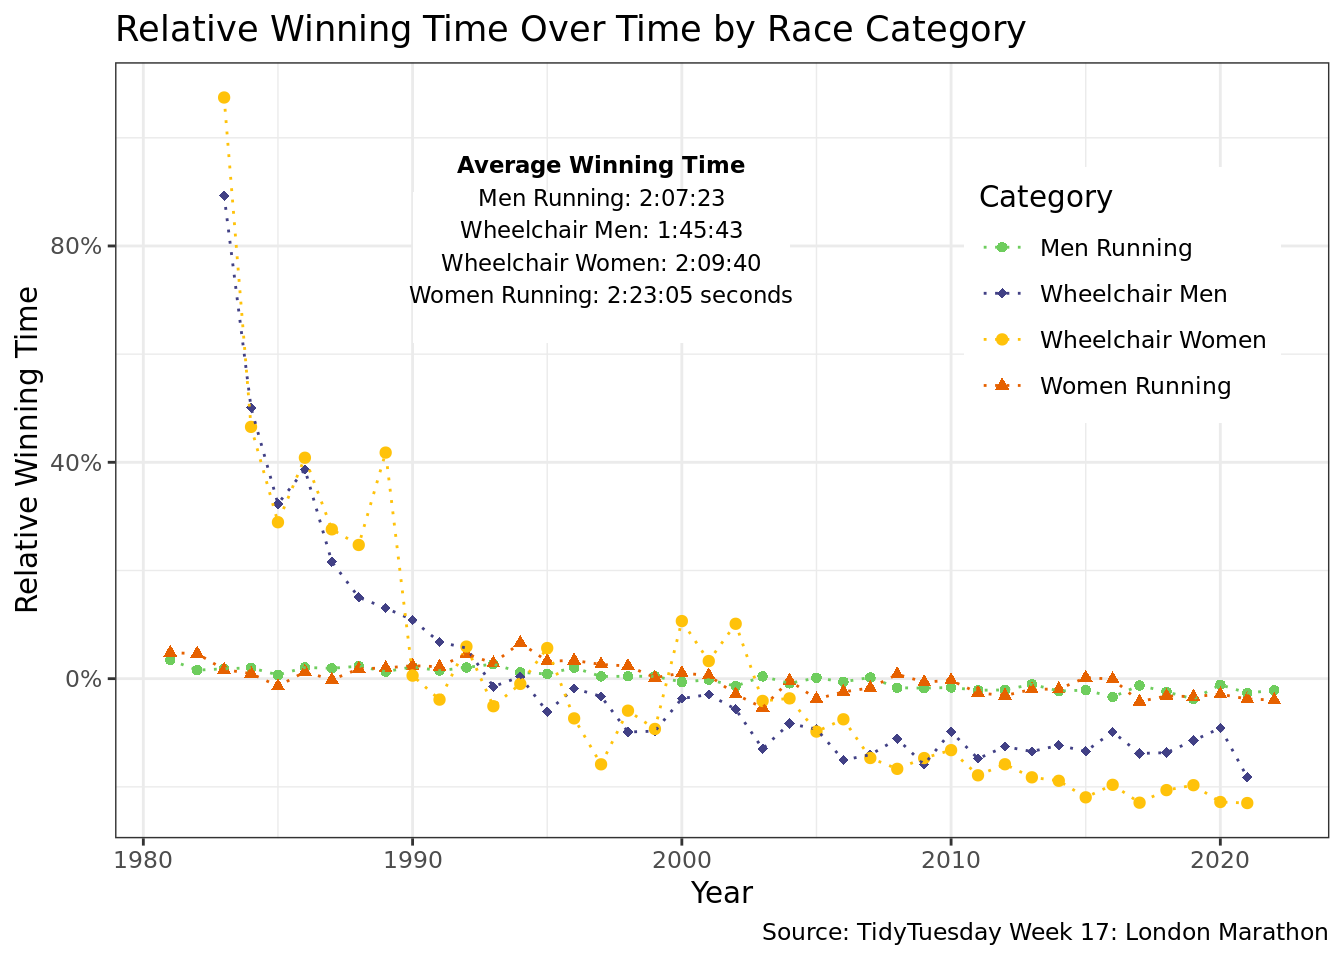
To answer question 1, the main plot we are using in a scatter plot that is connected by dotted lines using geom_point() and geom_line(), with four different colors for the four different race categories. The idea with these points and lines is to show the changes in the winning race times over our time period and the variability from year to year. We specifically did not use a line plot because we only have data points for individual years, and we do not want to lead the viewers to believe that there is data in between the years. The dotted line allows us to do this while still conveying trends in the data.
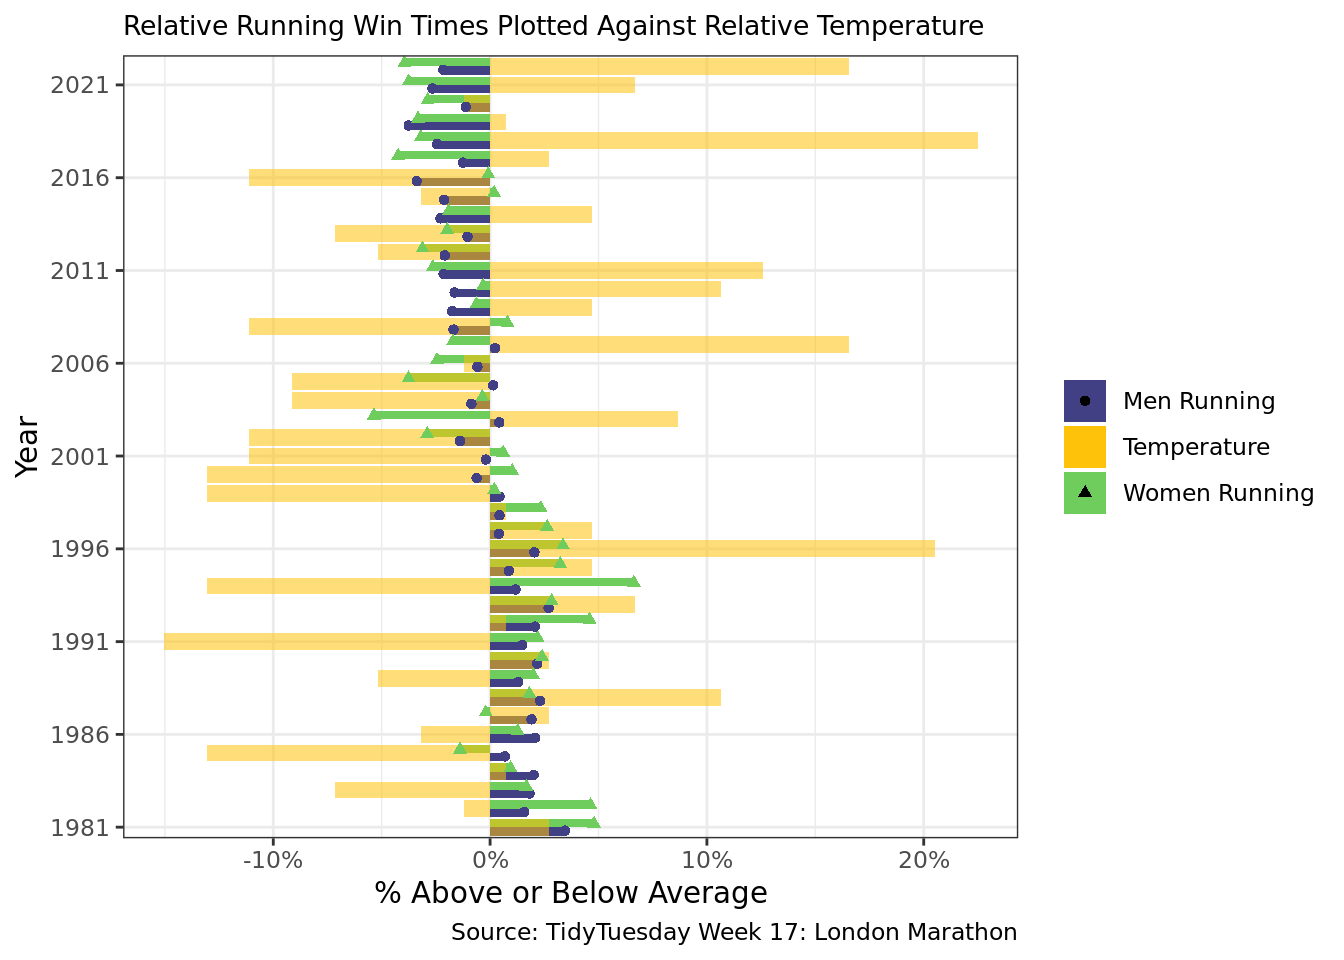
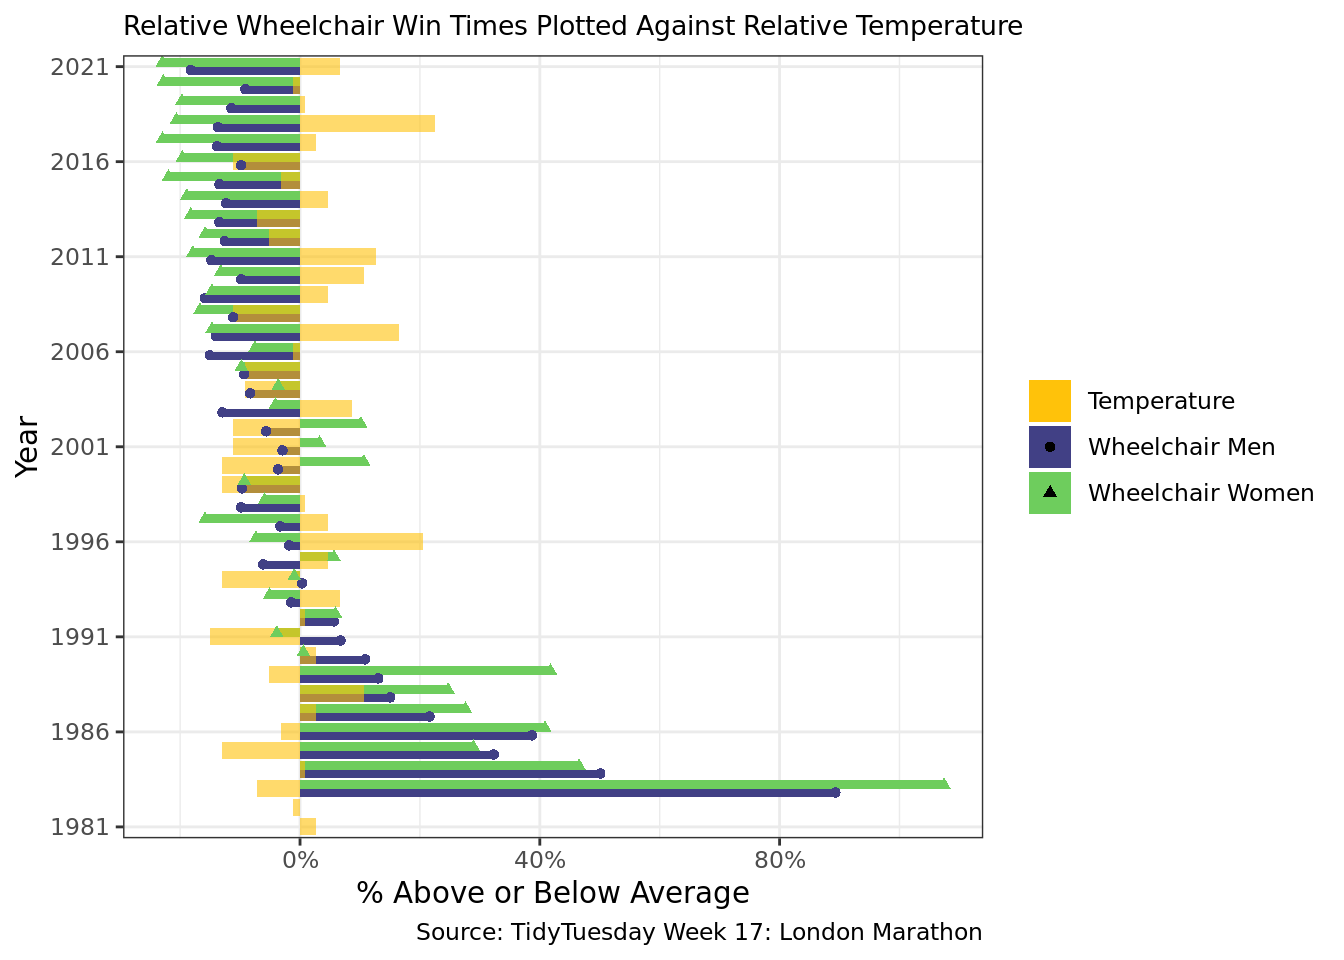
Our secondary plot for answering this question is a sideways bar chart using geom_col(). This chart adds the effect of a potential explanatory variable we thought was reasonable. The nature of this chart allows us to easily see the positive or negative directions of both relative win time and relative temperature, making them easy to compare. If we were to have just added temperature to the scatter and line plot, it would be much more difficult to compare either above-average or below-average winning times and temperatures to each other.
Warning: A numeric `legend.position` argument in `theme()` was deprecated in ggplot2
3.5.0.
ℹ Please use the `legend.position.inside` argument of `theme()` instead.
Discussion
From the first plot, we see that Wheelchair Men and Women started with the largest relative win time (85% and 95% for men and women wheelchair, respectively). Over time, the relative win time for both wheelchair divisions have decreased over time significantly, with both values going below 0% relative win time in 1993 (indicating that the winning time in 1993 is faster than the average winning time for the whole time period). The reason for the drastic drop in times is the change of technology in the wheelchairs that were used in the marathon: back then, the wheelchairs that were used resembled medical wheelchairs, which is not ideal when prioritizing speed. As we move to more recent times, the wheelchair technology improved significantly, and the wheelchairs are much more aerodynamic. These wheelchairs also can take advantages of downhill slopes much easier than a manual runner can, allowing them to maintain more speed for a longer time, due to the mobility source being the machine itself.
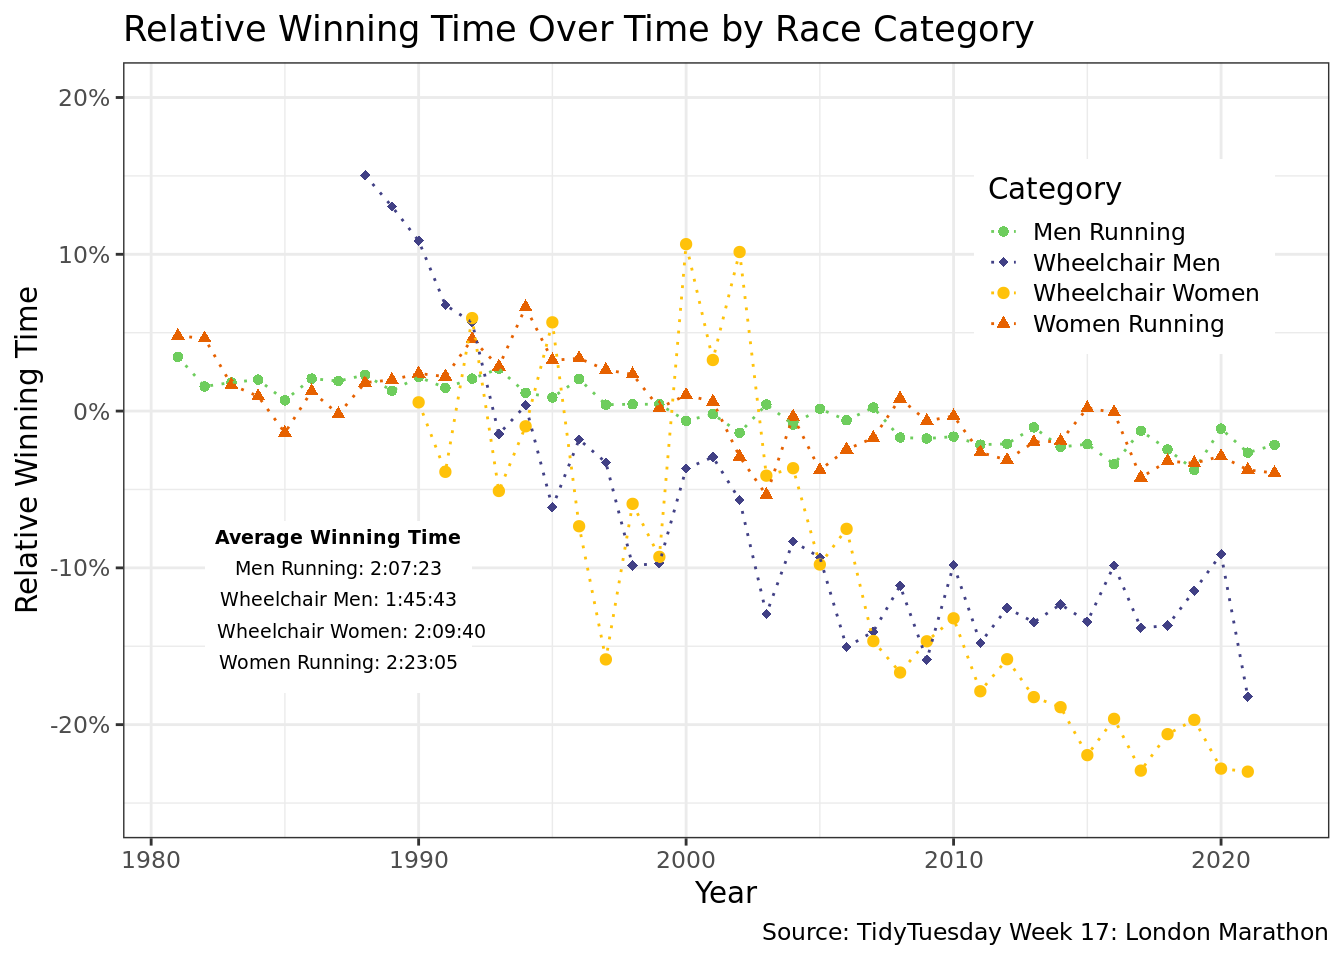
We also included the zoomed-in version of the plot, getting rid of any observations over 20% the average winning time to easier see the men’s and women’s running marathons. For men & women running, there really isn’t much deviation from the average winning time, with the times mostly deviating no more than ±5% from the average winning time. Despite only little deviation, we do see a slight trend downward in winning times, with the most recent marathons generally being below 0% in relative win time, and the oldest marathons being over 0% in relative win time.
The second type plot we added was a sideways, stacked bar graph that measures race times relative to the average by year, with temperature plotted over it. We did this to see if there was any relationship between performance in the race and temperature. There appears to be no apparent relationship between the two– temperature and winning time do not seem to have much overlap per the plot for both wheelchair and running marathons, despite our original thoughts that an “optimal” temperature range would enhance performance.
Question 2: Trends in Marathon Acceptance Rates and Race Completion Rates
Introduction
The second question we want to answer is how the acceptance rate for the London Marathon deviates from the overall average acceptance rate since 1981. We can use the london_marathon dataset to answer this question, specifically, the applicants and accepted racers to derive an acceptance rate, and race starters and finishers to derive the race completion rate.
We want to explore this question because it provides an insight into the participation dynamics and runner preparedness for the marathon over time. Moreover, it would help event managers plan where to staff people and resources for the race. Acceptance rates could be useful to see the trends of selectivity over time. These insights could be paired together to see whether changes in race completion rates drive potential changes in acceptance rates.
Approach
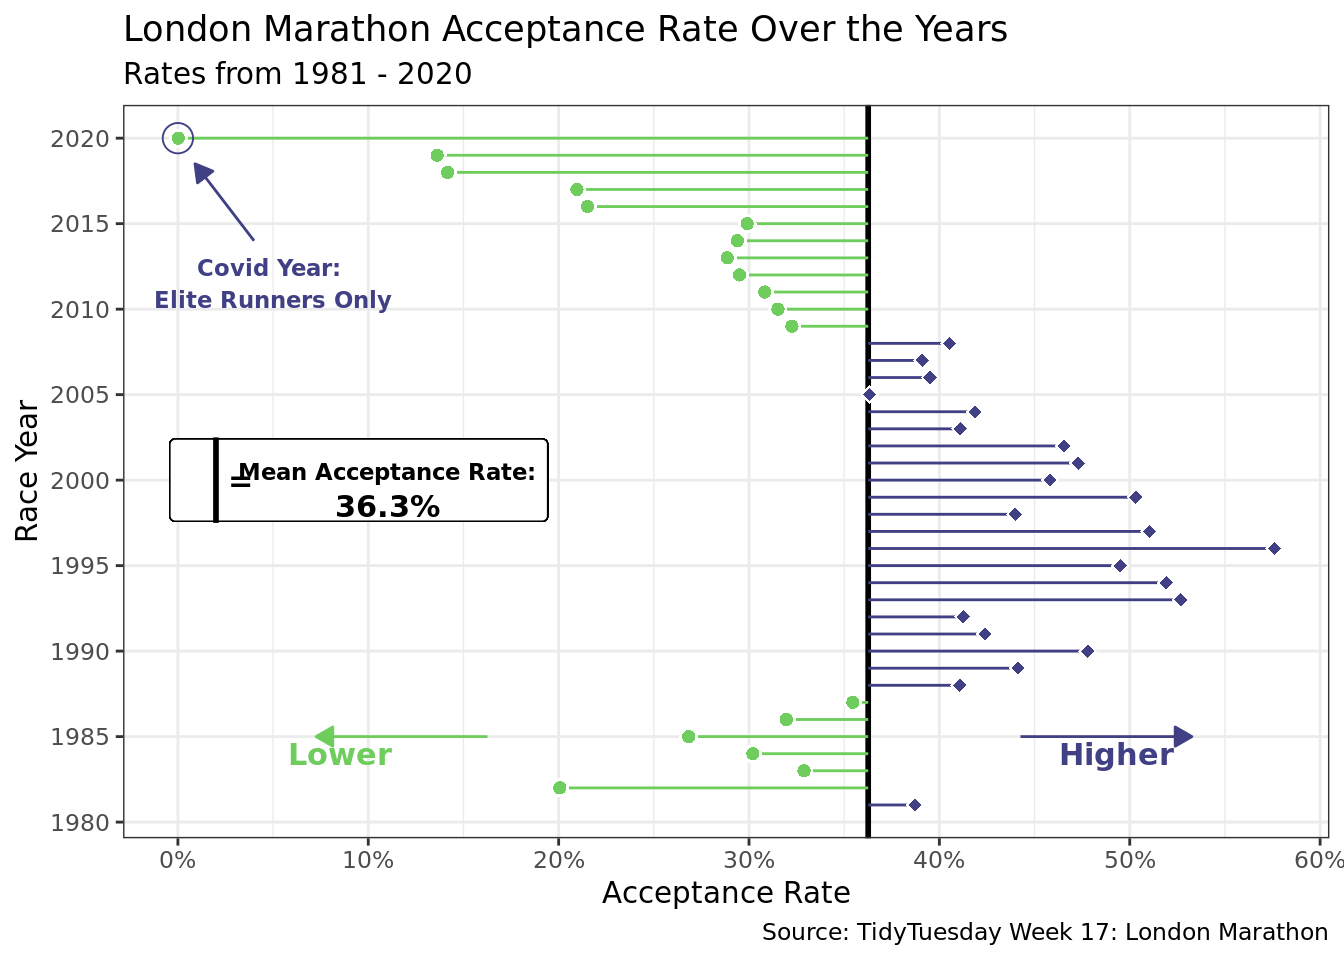
To address the question of how acceptance rate changes over time, we will use a scatterplot with segments connecting each year to the average. This plot is best to show data over the entire time horizon because it makes it clear how much the acceptance rate in any given year deviates from the mean. The deviation is emphasized by the length of the line segments, as the bigger the line segment is, the larger its deviation from the mean. Moreover, the vertical line, along with the color, creates a clear barrier between acceptance rates that are above average and acceptance rates that are below average.
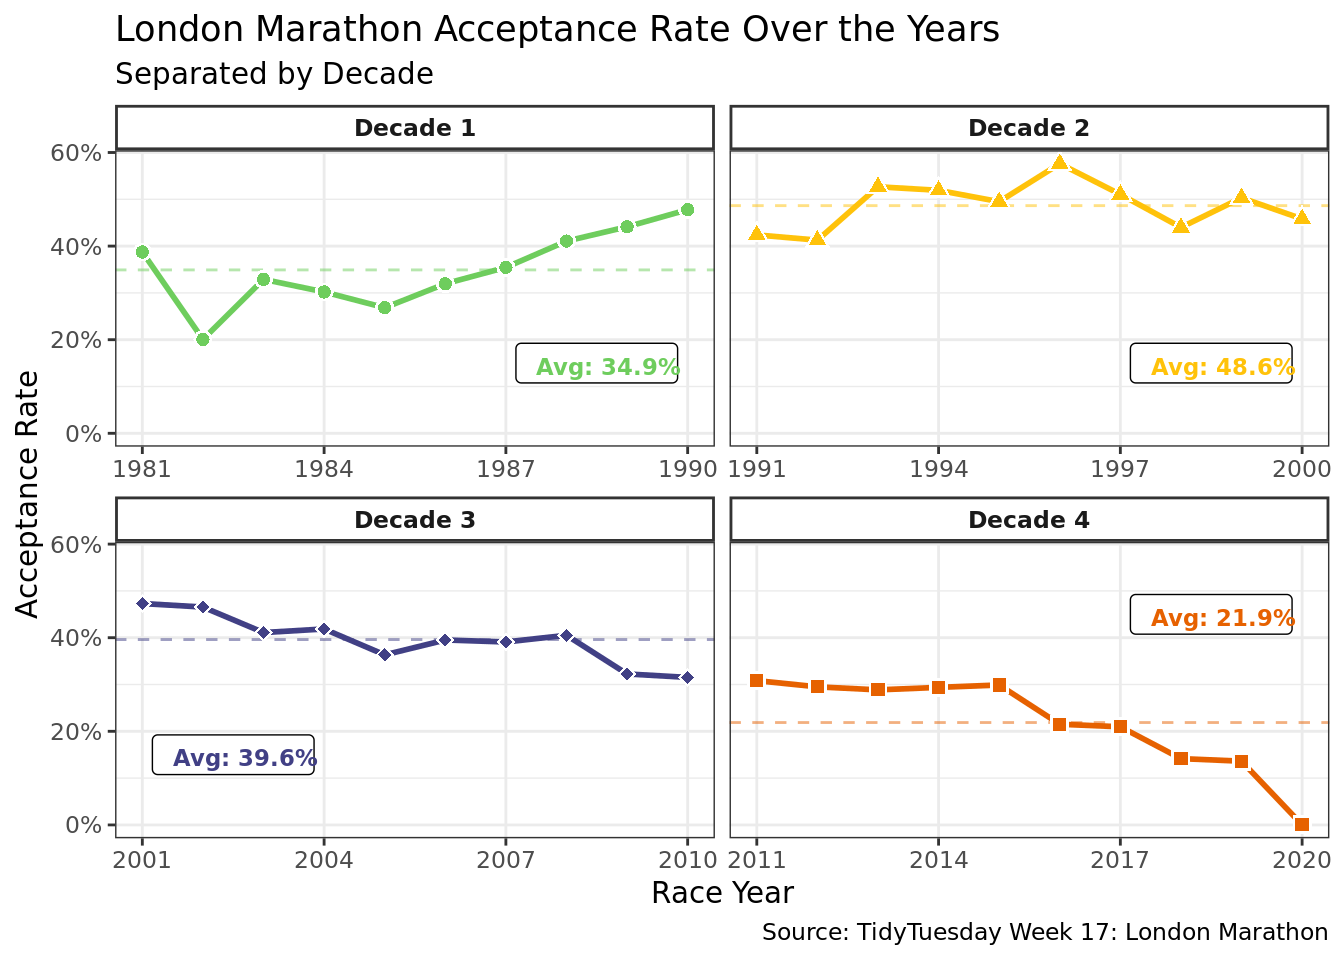
We will also use line graphs, faceted by decade, to dive deeper into the trends over different time segments. A line graph is one of the most intuitive ways to visualize time series data because of its clarity and obvious display of trends over time. To emphasize that the data is yearly, we will overlay the line graph with points to represent each observation. Since there are under 50 data points being graphed, it makes sense to show each one individually, as it is not subject to crowding the visualization. Furthermore, the faceting evenly distributes the data into four plots, which makes it possible to analyze trends decade by decade.
Analysis
Discussion
Our first plot measures the marathon’s acceptance rate over the years relative to the mean, which is an acceptance rate of 36.3%. We see that in the beginning of our time period, the acceptance rate was lower than the period average (1982-1986). For the years following, from 1986 to 2008, we see that the acceptance rate had increased, with each year being over the average acceptance rate of 36.2%. Finally, from 2008 to 2020, we see that the acceptance rate decreased, mainly being below the mean, with 2020 being an exceptionally low year (due to COVID restrictions, only elite runners were accepted to the race).
The second graph shows the acceptance rate of the London Marathon for each decade (Decade 1 being the 80s, Decade 2 being the 90s, Decade 3 being the 00s, and Decade 4 being the 10s). From this visualization, we see that Decade 2 had the highest average acceptance rate at 48.6%, followed by Decade 3 at 39.6%, Decade 1 at 34.9%, and finally Decade 4 having the lowest acceptance rate at 21.9%. It does seem to make sense that the general trend of acceptance rates is downward trending, as the London marathon does get bigger and since the number of fast runners increases over time.