UFO Sightings in the US
STA/ISS 313 - Project 1
Abstract
This project investigates UFO reports in the United States. Our main goal was to identify trends in UFO sightings and look into why these trends may exist. We had two main approaches. The first was by analyzing the location of UFO sightings, with specific regards to their location in relation to military bases due to speculation about military bases and alien activity. The second is by examining how these sightings have changed over time across decades, months, and days. We began by studying the distribution of UFO reports and military bases across the US and then specifically focused on the state with the highest count of UFO sightings and military bases: California. To accomplish our second approach, we highlighted the COVID-19 pandemic (year 2020) in relation to other decades before focusing in on the frequency of some common words within a typical year. Overall, we found that there does seem to be some correlation between UFO sightings and military bases. However, in California, it may be instead due to the location of major cities and the same could apply to other states. The year 2020 did disrupt the typical seasonal peak of UFO sightings in summer, and there appears to be a relationship between certain words and US holidays like Independence Day.
Introduction
This data comes from the National UFO Reporting Center and then was uploaded to GitHub by Sigmond Axel. The dataset contains UFO reports in various countries around the world and includes information such as location of sighting, time, shape etc. It contains three csv files (ufo_sightings, places, day_parts_map). The UFO dataset contains around 80,000 different UFO reports. For the purpose of our project we are only going to focus on reports that take place in the United States.
Question 1
Is there a correlation between UFO sightings and military bases across the US?
Introduction
To determine the relationship between the distribution of UFO sightings and military bases, we focused our analysis on a single year 2019. In our first visualization we look at the distribution of UFO sightings and military bases in each state to understand if one state tends to have more sightings than others and why this might be. In our second visualization we focus on the state with the most UFO sightings and most military bases (California) to visualize the relationship between the distribution of the location of UFO sightings and military bases. We hypothesized that the majority of UFO sightings would be on the west coast, but the goal is to understand why this may be. In particular, we are interested to see if there is a strong connection between military bases and UFO sightings due to speculation about connections between military bases and alien activity. We also included the five largest cities based on population in our second graph to see if the location of these five cities could explain any of the distribution of UFO sightings.
In order to complete this question we will be using two out of the three csv files in this dataset. We will be using ufo_sightings to analyze information about where these sightings occurred using variables like country_code to filter for only sightings in the US and state to filter by sightings only in California. We will also use the places and join this with ufo_sightings by state so that we can use the variables state to plot the distribution of sightings across the US and longitude and latitude to plot the points of sightings in California. For both parts of this question we are interested in seeing if the UFO sightings tend to gather around military bases, so we added another dataset that contains the coordinates for known military bases as well as their state and information on activeness “Military Bases” (2019). Finally, we included a dataset on population of cities in California (cal_populations) and longitude/latitude of cities in California (cal_locations) in order to plot the five largest cities in California to see if the distribution of UFO sightings could be explained by its proximity to any major cities “California Cities Dataset” (2019).
Approach
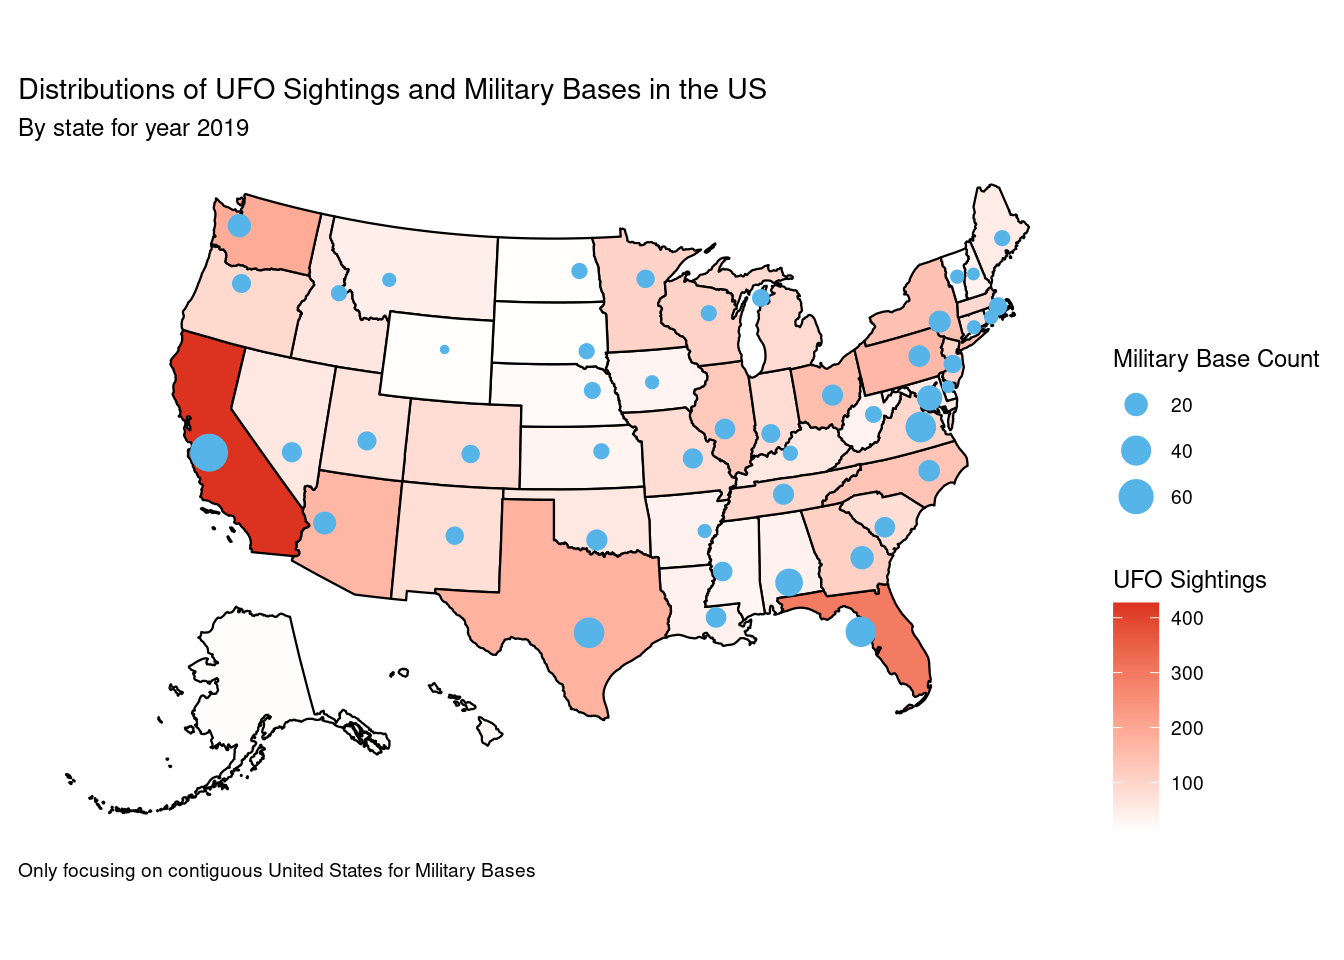
For our first plot we made a density map of the US colored by state. The density is based on the count of UFO sighting in each state from the year 2019. The density map will allow us to clearly see which state has the most UFO sightings in a visually appealing and easy to read way. Additionally, we plot a dot in the middle of each state that is sized based on the count of military bases in the state. We chose to only show data from 2019 because our military_bases dataset contained data on military bases from 2019, and we also wanted to avoid the distrubance of COVID-19 which began in 2020. We also did not include military base count for Hawaii and Alaska because plotting their centroids disrupted the map and there was very little data pertaining to UFO sightings in either state.
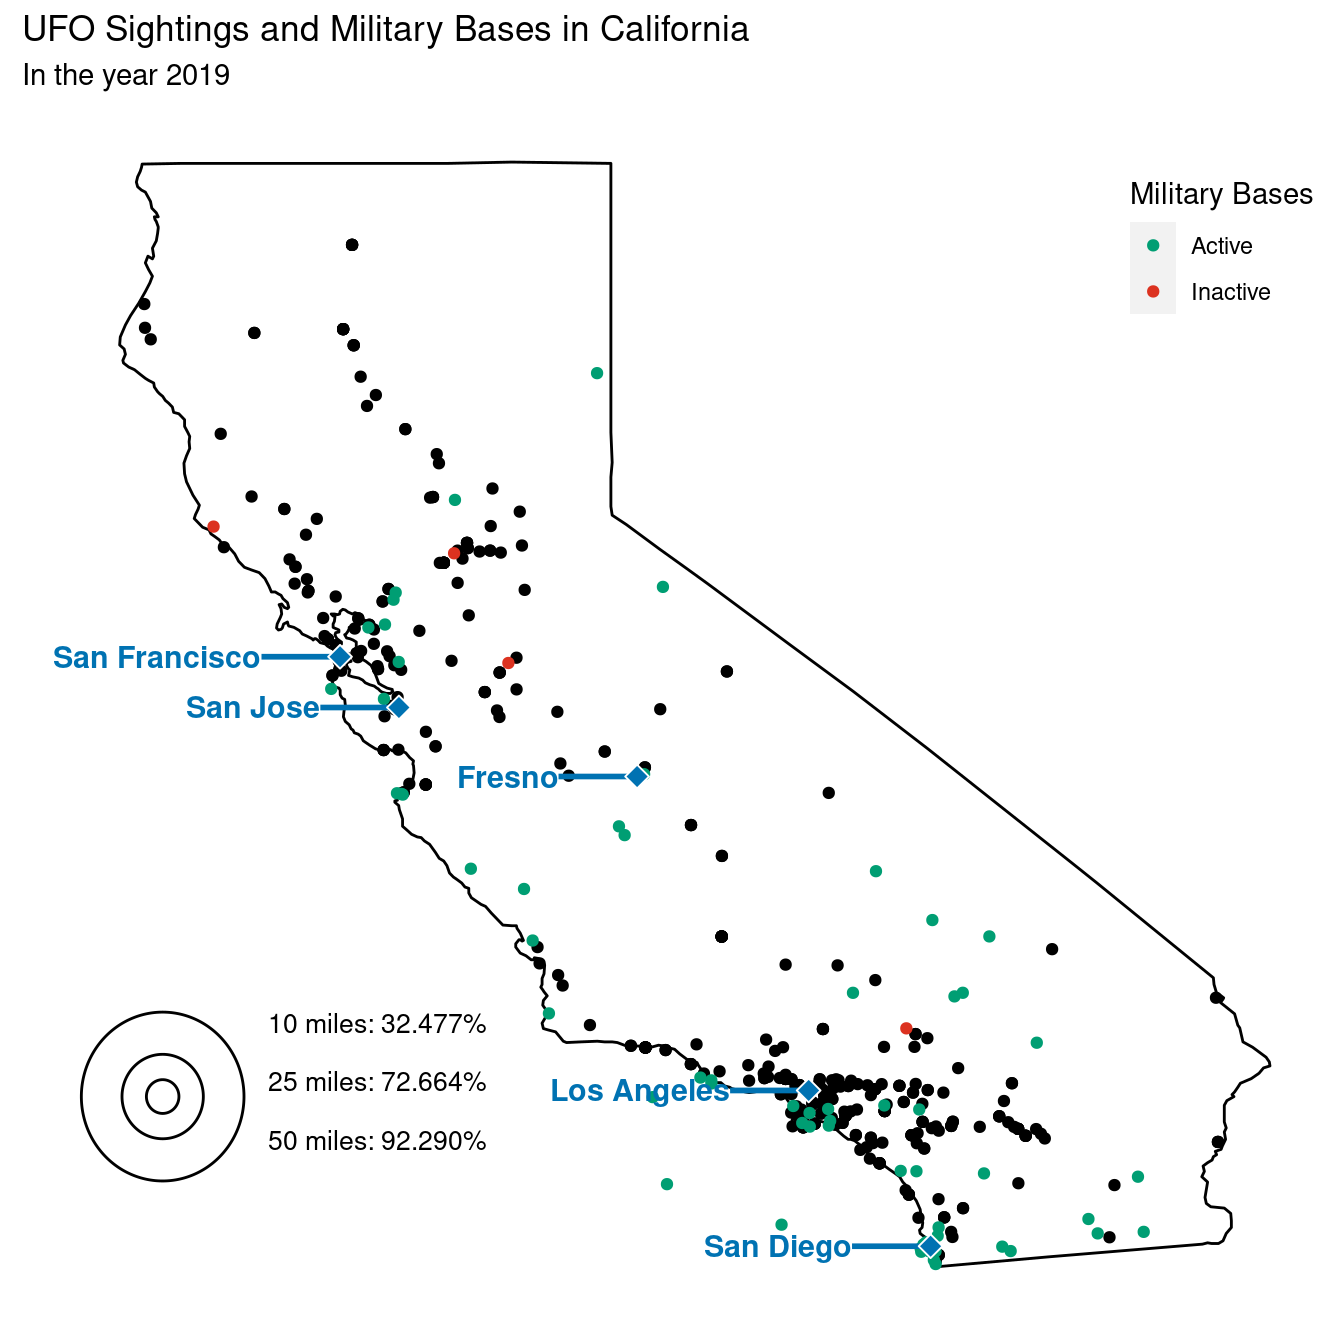
For our second plot we made a geographic dot plot of the latitude and longitude points of each sighting in the year 2019 from California. California had the highest number of sightings, as well as the most military bases. We wanted to see if individual UFO sightings are correlated with military bases, so we plotted the points of each military base’s location in California in the year 2019 on top of the UFO sighting points and colored the military bases by green if they were active and red if they were inactive. This will allow us to see where the majority of sightings happened within the state of California, as well as their correlation with and spatial relation to military bases in California. We also did further analysis on the data and calculated the percentage of sightings that fell within a 10, 25, and 50 mile radius of a military base contributors (2011), “Calculating Distances Between Two Geo-Coded Locations” (2017). We included circles of each of these three sizes for reference in our plot and the percentage of sightings that occurred within each size radius from a military base ggforce (2019). Finally, we plotted the five largest cities in California based on population from the 2010s in order to see if the distribution of UFO sightings could be explained by the proximity to these major cities.
Analysis
Discussion
The goal of Figure 1 was to understand if UFO sightings (in 2019) are more common in states that have high numbers of military bases. Based on the density map, it is clear that the states which are the most populated by UFO sightings also have the most military bases. California and Florida have the greatest number of UFO sightings in 2019. California also has the most military bases while Florida has the third most. There does seem to be some discontinuity with this idea because Virginia has a lower number of UFO sightings, but the second highest number of military bases. For the most part the map is consistent with the idea that states that have more military bases are the states where there are more UFO sightings, besides a few outliers. There are also less UFO sightings for states with less military bases like Wyoming for example has the least amount of military bases and the fourth least amount of UFO sightings. This makes sense because there is always speculation about what goes on at US military bases with regards to alien activity, so it would be plausible that there are more UFO sightings in states with high numbers of military bases. However, a limitation of this analysis is that states with more military bases like California and Florida are more populated and therefore there are more people to report UFO sightings.
In Figure 2 we looked at the distribution of individual UFO sightings and their relationship to the location of military bases in 2019 in California. The UFO sightings seem to be concentrated around military bases. While there are some UFO sightings that are not necessarily near a military base, it seems as though the majority of sightings are located close to a military base. There is a heavy concentration of UFO sightings and military bases in the bottom right portion and middle/top left portion of the graph, while the space in between these two main clusters are much less concentrated. This could be because there are not many military bases in the space between these two groups, or because major cities in California (Los Angeles, San Diego, San Francisco, San Jose, Fresco) are located in the heavily concentrated sections on the graph. We can see that the individual UFO sightings are concentrated around military bases and major cities, indicating that there is a relationship between UFO sightings and military bases as well as UFO sightings and cities. Upon further calculation we came to the conclusion that approximately 32.477% of UFO sightings were in a 10 mile radius of a military base, 72.664% were within a 25 mile radius, and 92.290% were within a 50 mile radius. Within a 50 mile radius of each military base about 92.290% of sightings occurred, which leads to the conclusion that there is a high correlation between military bases and UFO sightings. While only 32.477% were within a 10 mile radius, there may be restrictions on how close civilizations can get or live to a military base, which may account for the lower percentage within a 10 mile radius. It was not surprising that the clusters of UFO sightings were centered around major cities, but our findings about the relationship between military bases and UFO sightings was quite interesting.
Question 2
How have UFO sightings changed over time? Why?
Introduction
As time has passed and technology has advanced, we are curious as to how UFO sightings may or may not have changed, especially relative to the pandemic in which many may have had more free time at home. We also hope to capture seasonal any seasonal patterns in UFO sightings and examine their causes. Naturally, we will be focusing our analysis on the time of sightings (reported_date_time). Additionally, exploring the contents of UFO descriptions (summary) may also reveal insights into how the perception of UFOs has changed. These questions are interesting to us because of the subjective and diverse nature of reported UFO sightings, as well as a hypothesis that reported UFO sightings may be explained by normal phenomena and misunderstandings.
Approach
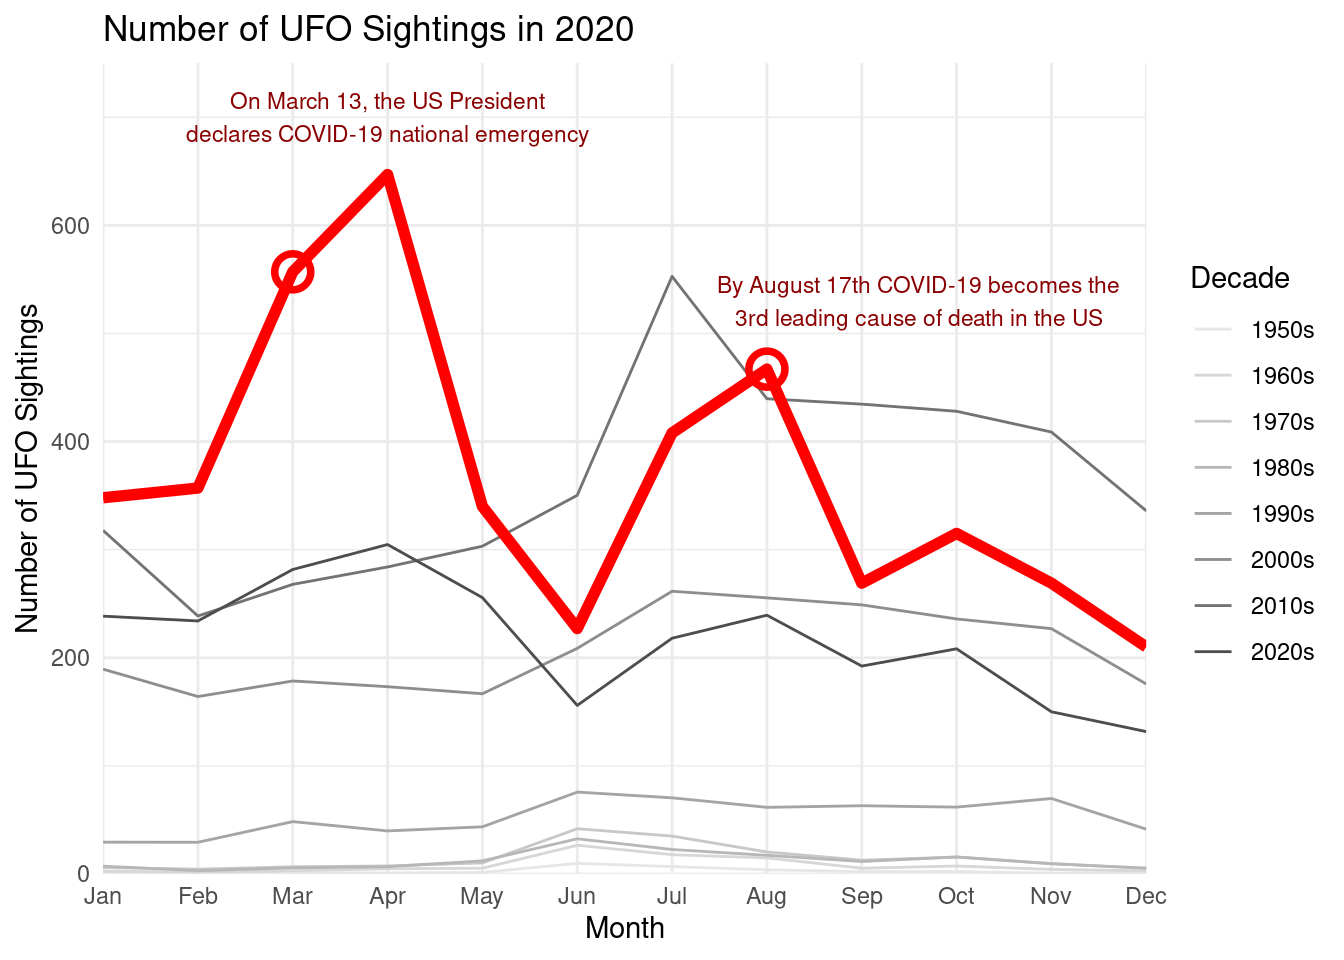
To begin, we wanted to capture the evolution of observations across decades beginning from 1950 until the end of our dataset in May 2023. The form of visualization chosen was a line graph with months on the x-axis and average counts on the y-axis. Due to the large number of years of data, lines were grouped and colored by decade. Such a grouping method still allowed us to capture trends over time while also allowing some glimpses into general seasonal patterns across months. In order to highlight our focus on how the pandemic affected UFO sightings, we overlaid an additional line for 2020 (the start of the pandemic) using a larger size and vibrant red on top of gray lines for decades.
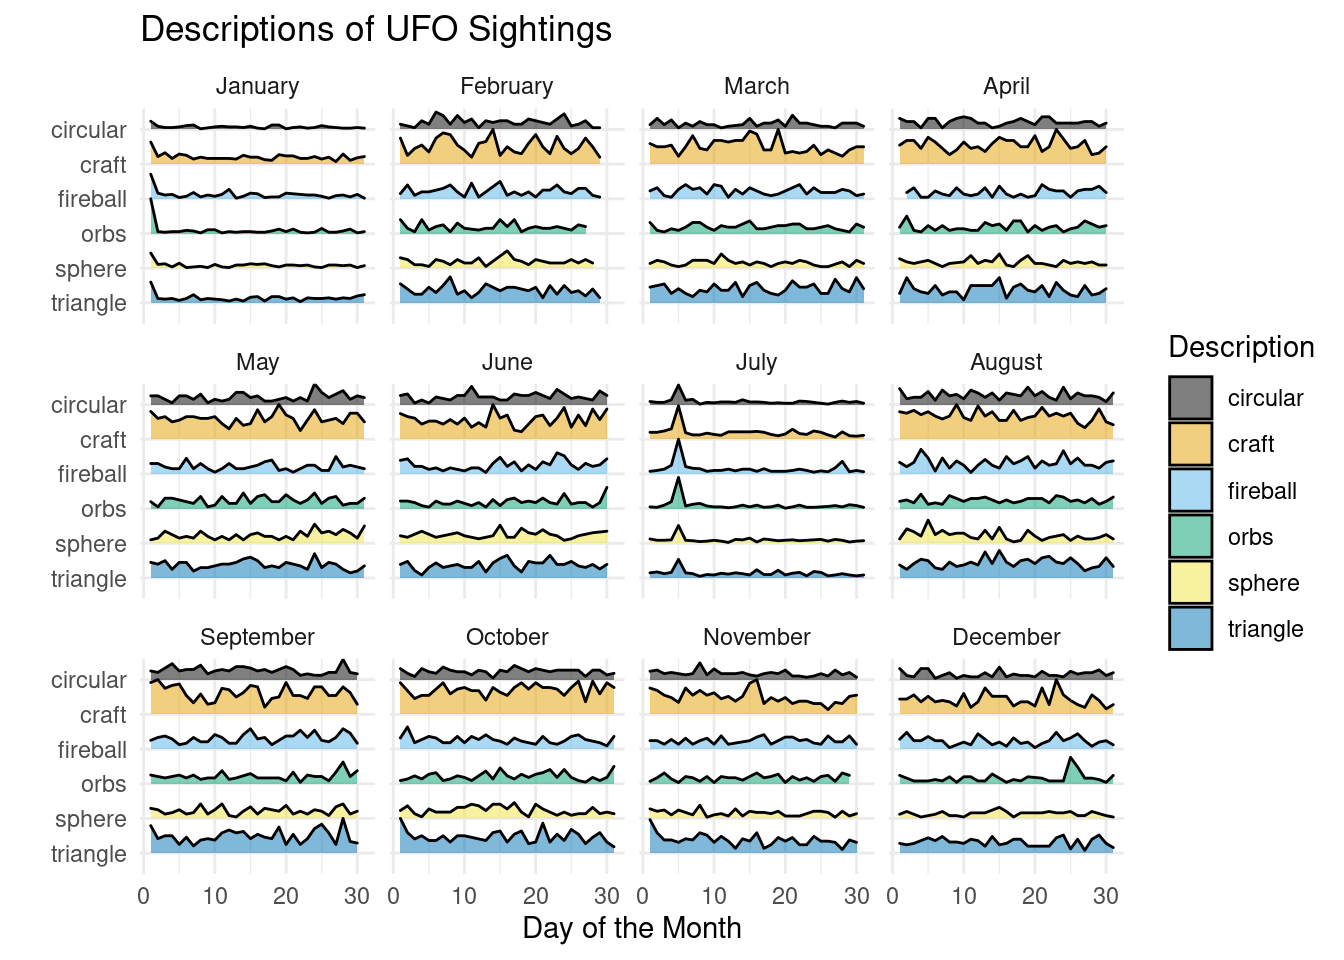
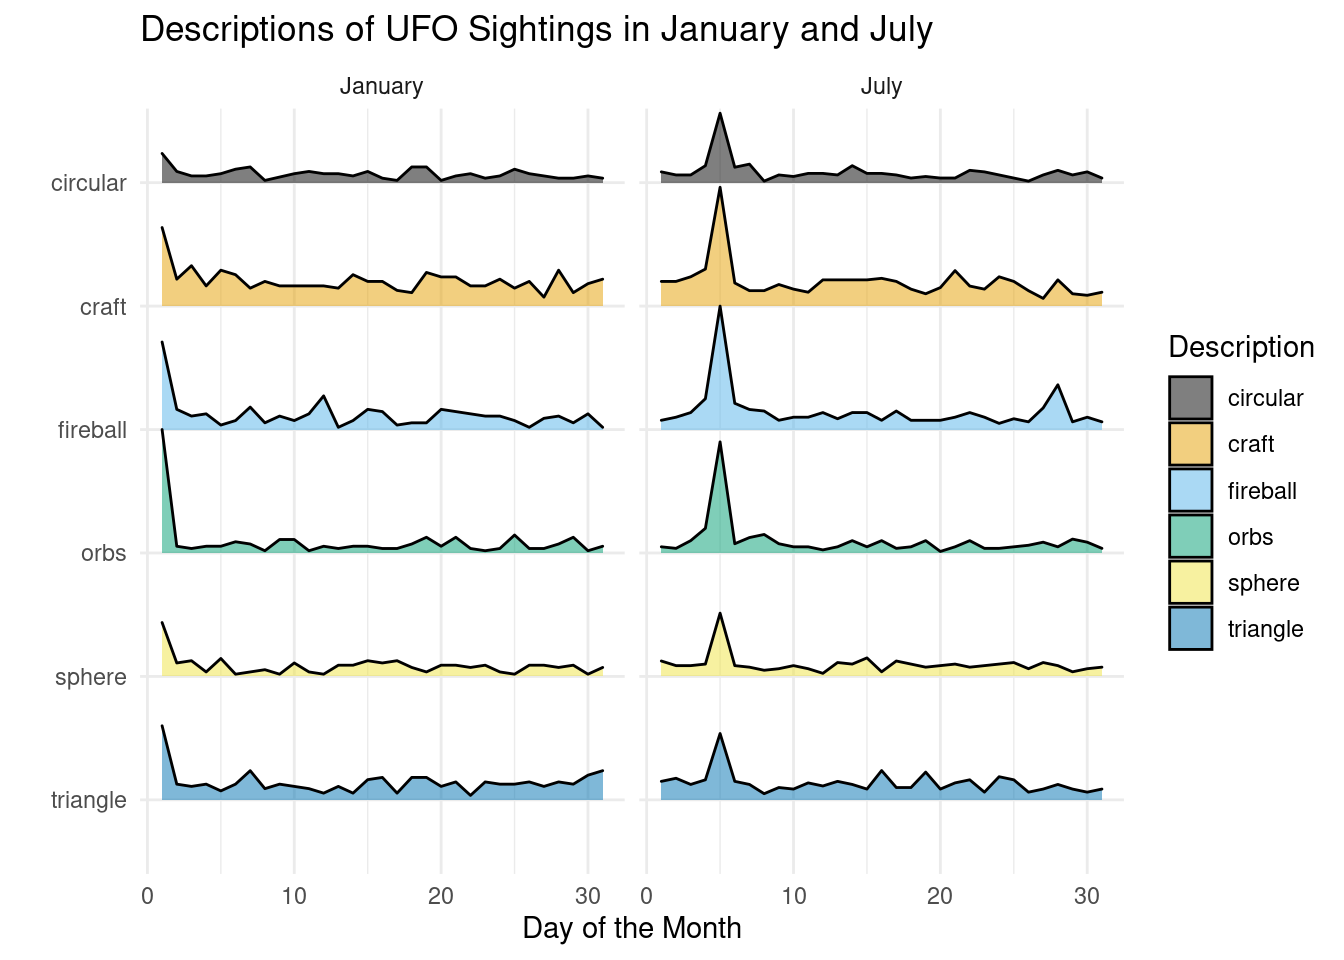
Next, we turned our attention away from the pandemic to instead focus in on observed seasonal patterns. The second plot is a ridgeplot that looks at some of the commonly used descriptors when reporters summarize UFO incidents. In particular, we are focusing in on January and July. Two key days with the greatest number of observations occur in these months. Choosing this kind of plot allows us to make comparisons between descriptors and see the distribution of sightings across both months.
Analysis
Annotations are sourced from “A Timeline of COVID-19 Developments in 2020” (2021).
Discussion
In Figure 3 it is evident that there has been a general increase in the number of UFO sightings across decades up until the 2020s. This may be due to an actual increase in sightings and approaching aliens, however, there is reason to be cautious. The general increase in sightings over time may be due to an increase in media surrounding UFOs, thus leading to more claims of UFO sightings. Alternatively, this may in part be due to advances in technology in the invention of drones and other ariel technologies. Additionally, this may be due to a loss of historical data on UFO sights and the increase in ease of reporting sightings in the modern day.
While the irregular peak in sightings in spring for the 2020s is irregular enough, the highlight of Figure 3 is the bold, red line representing the year 2020. 2020 is particularly special as it is when the COVID-19 pandemic really began. Comparing the distribution of sightings in this year with the peaks and troughs of COVID-19 cases in the US, it is plausible to conclude there may be some correlation between the early phases of lockdowns and UFO sightings. This may be attributed to people having more time to spend watching entertainment and exploring their passions while being unable to travel.
When observing the ridgeplot (Figure 4) displaying the distribution of UFO descriptions across all months, it becomes extremely apparent that January and July really stand out from having brief very prominent peaks in usage among all words. All the other months seemed to have no discernible pattern or correlation. As such, we decided to take a closer look at January and July in Figure 5 and observed that the greatest peak in UFO descriptions was July 5th. Additionally, the day with the second most observed UFO descriptions across all years is January 1st despite many other months having higher total cumulative observations. The usage of descriptive words such as circular, craft, fireball, orbs, sphere, and triangle, seemed to have no correlation with each other apart from January 1st and July 5th. Additionally, fireball has an second peak in usage on July 28th. We believe that these massive peaks in reported UFO sightings are not only due to fireworks going off in celebration of holidays such as New Years and Independence Day, but also flying vehicles that might be present. Additionally, incidents like the Chinese rocket re-entry on July 28th 2016 and other space debris result in large peaks in reported UFO sightings.
References
“A Timeline of COVID-19 Developments in 2020.” 2021. https://www.ajmc.com/view/a-timeline-of-covid19-developments-in-2020.
“Calculating Distances Between Two Geo-Coded Locations.” 2017. Exploratory Blog. https://blog.exploratory.io/calculating-distances-between-two-geo-coded-locations-358e65fcafae.
“California Cities Dataset.” 2019. https://www.kaggle.com/datasets/camnugent/california-housing-feature-engineering.
contributors, StackOverflow. 2011. “Calculating Distance Between Two Latitude and Longitude Geocoordinates.” https://stackoverflow.com/questions/6366408/calculating-distance-between-two-latitude-and-longitude-geocoordinates.
ggforce. 2019. Geom_circle. https://ggforce.data-imaginist.com/reference/geom_circle.html.
“Military Bases.” 2019. https://public.opendatasoft.com/explore/dataset/military-bases/information/?flg=en-us.